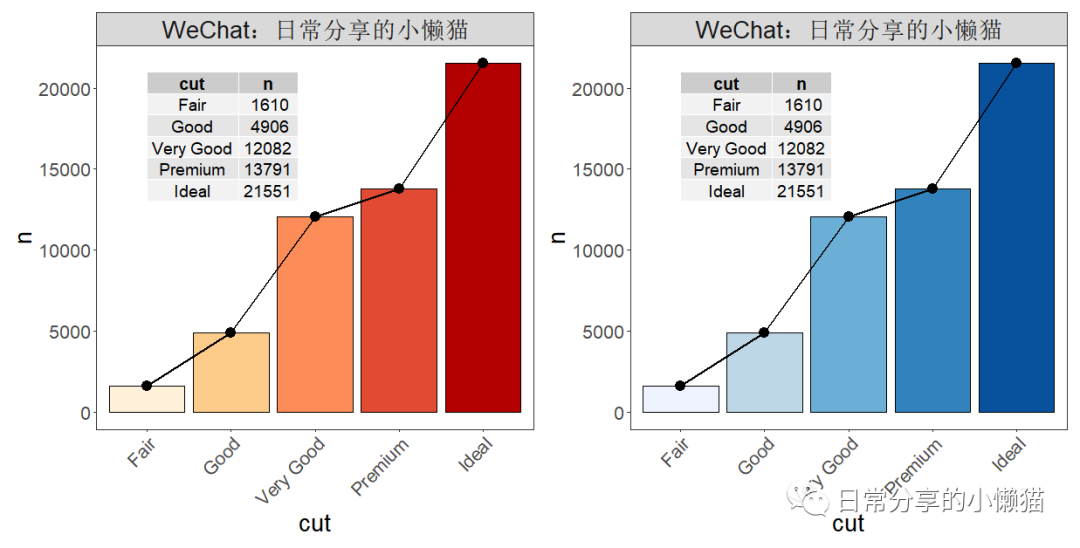
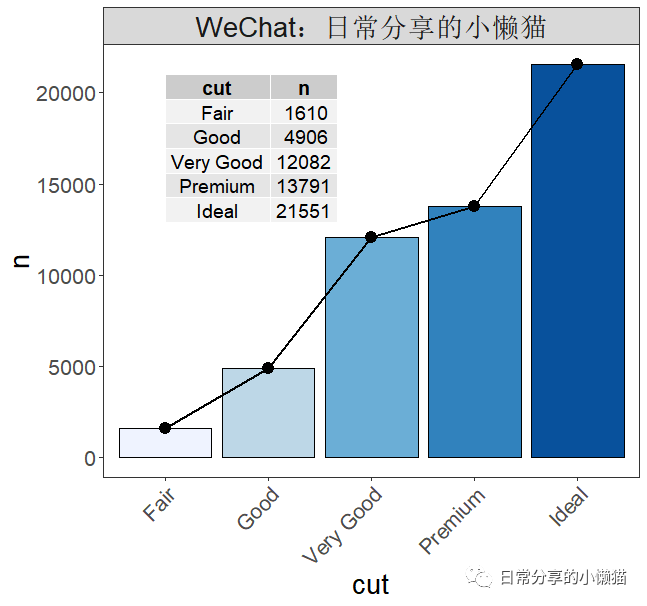
本文主要展示ggplot2在绘制条形图或折线图时,如何往图中添加表格信息,如下图所示:更多内容可关注微信公众号【日常分享的小懒猫】。

1、数据准备
library(ggplot2)
library(dplyr)
library(ggpmisc)

diamonds.df <- diamonds %>% group_by(cut) %>% summarise(n = n())
diamonds.df
#  cut           n
#  <ord>     <int>
#1 Fair       1610
#2 Good       4906
#3 Very Good 12082
#4 Premium   13791
#5 Ideal     21551
2、图形绘制
ggplot(diamonds.df, aes(cut, n, group = 1)) +
  geom_col(aes(fill = cut),  color = "black") +
  geom_line(size = 1) +
  geom_point(size = 4) +
  annotate(geom = "table",label = list(diamonds.df), x= 1, y = 21000,  size = 5) +
  theme_bw() +
  scale_fill_brewer(palette = "Blues") +
  theme(panel.grid = element_blank(),
        text = element_text(size = 20),
        axis.text.x = element_text(angle = 45, hjust = 1),
        legend.position = "none")

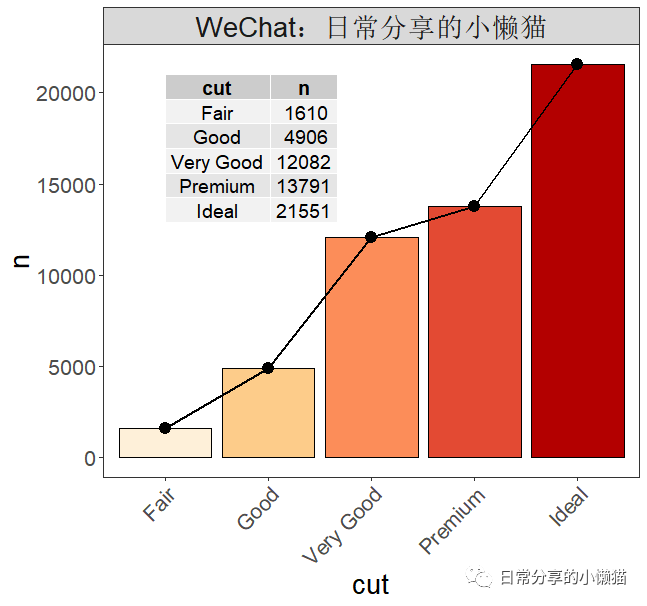
修改颜色
ggplot(diamonds.df, aes(cut, n, group = 1)) +
  geom_col(aes(fill = cut),  color = "black") +
  geom_line(size = 1) +
  geom_point(size = 4) +
  annotate(geom = "table",label = list(diamonds.df), x= 1, y = 21000,  size = 5) +
  theme_bw() +
  scale_fill_brewer(palette = "OrRd") +
  theme(panel.grid = element_blank(),
        text = element_text(size = 20),
        axis.text.x = element_text(angle = 45, hjust = 1),
        legend.position = "none")

解读:通过annotate() 函数实现表格添加功能。其中,geom为图层形式,label为数据表格,x、y表示表格的位置,size为表格内文本的大小。
3、其他
其他绘图方法可进一步阅读公众号其他文章。更多内容可关注微信公众号【日常分享的小懒猫】。
如有帮助请多多点赞哦!
文章转载自日常分享的小懒猫,如果涉嫌侵权,请发送邮件至:contact@modb.pro进行举报,并提供相关证据,一经查实,墨天轮将立刻删除相关内容。


