


压测场景
客户端:Benchmarksql(10.20.30.199)
服务端:PostgreSQL(10.20.28.190)
抓包命令:tcpdump -i any -s 0 ‘port 5432 and host 10.20.28.190’ -w 190have_noindex.cap
客户单ping数据库情况
[root@10-20-30-199 ~]# ping -c 10 10.20.28.190
PING 10.20.28.190 (10.20.28.190) 56(84) bytes of data.
64 bytes from 10.20.28.190: icmp_seq=1 ttl=63 time=0.255 ms
64 bytes from 10.20.28.190: icmp_seq=2 ttl=63 time=0.226 ms
64 bytes from 10.20.28.190: icmp_seq=3 ttl=63 time=0.203 ms
64 bytes from 10.20.28.190: icmp_seq=4 ttl=63 time=0.191 ms
64 bytes from 10.20.28.190: icmp_seq=5 ttl=63 time=0.424 ms
64 bytes from 10.20.28.190: icmp_seq=6 ttl=63 time=0.431 ms
64 bytes from 10.20.28.190: icmp_seq=7 ttl=63 time=0.535 ms
64 bytes from 10.20.28.190: icmp_seq=8 ttl=63 time=0.206 ms
64 bytes from 10.20.28.190: icmp_seq=9 ttl=63 time=0.206 ms
64 bytes from 10.20.28.190: icmp_seq=10 ttl=63 time=0.197 ms

--- 10.20.28.190 ping statistics ---
10 packets transmitted, 10 received, 0% packet loss, time 9001ms
rtt min/avg/max/mdev = 0.191/0.287/0.535/0.120 ms
数据库表上有索引
bencharksql压测数据
progress: 41.0, tpmTOTAL: 55374.3, tpmC: 24903.8
progress: 42.0, tpmTOTAL: 55807.2, tpmC: 25100.8
progress: 43.0, tpmTOTAL: 56178.2, tpmC: 25313.8
progress: 44.0, tpmTOTAL: 56472.4, tpmC: 25462.6
progress: 45.0, tpmTOTAL: 56788.1, tpmC: 25624.8
progress: 46.0, tpmTOTAL: 57139.6, tpmC: 25811.2
progress: 47.0, tpmTOTAL: 57436.7, tpmC: 25946.3
progress: 48.0, tpmTOTAL: 57633.8, tpmC: 26002.0
progress: 49.0, tpmTOTAL: 57953.9, tpmC: 26185.2
progress: 50.0, tpmTOTAL: 58200.1, tpmC: 26285.6
progress: 51.0, tpmTOTAL: 58477.7, tpmC: 26386.5
progress: 52.0, tpmTOTAL: 58783.9, tpmC: 26527.6
progress: 53.0, tpmTOTAL: 59081.9, tpmC: 26687.0
progress: 54.0, tpmTOTAL: 59298.9, tpmC: 26782.8
progress: 55.0, tpmTOTAL: 59559.3, tpmC: 26887.1
progress: 56.0, tpmTOTAL: 59730.0, tpmC: 26956.7
progress: 57.0, tpmTOTAL: 59846.3, tpmC: 27012.2
数据库表上删除个别表主键
目的:删除索引后,SQL效率变慢的情况进行压测,得到的压测结果维持在2000tpmC
progress: 42.1, tpmTOTAL: 5343.7, tpmC: 2498.6
progress: 43.1, tpmTOTAL: 5239.2, tpmC: 2453.8
progress: 44.0, tpmTOTAL: 5245.2, tpmC: 2446.0
progress: 45.0, tpmTOTAL: 5176.6, tpmC: 2413.7
progress: 46.0, tpmTOTAL: 5115.5, tpmC: 2379.8
progress: 47.0, tpmTOTAL: 5094.5, tpmC: 2375.5
progress: 48.0, tpmTOTAL: 5047.9, tpmC: 2350.3
progress: 49.0, tpmTOTAL: 5049.6, tpmC: 2337.5
progress: 50.0, tpmTOTAL: 4980.4, tpmC: 2300.1
progress: 51.0, tpmTOTAL: 4941.6, tpmC: 2284.3
progress: 52.0, tpmTOTAL: 4960.9, tpmC: 2303.9
progress: 53.0, tpmTOTAL: 4929.5, tpmC: 2288.2
progress: 54.0, tpmTOTAL: 4936.7, tpmC: 2294.0
progress: 55.0, tpmTOTAL: 4893.6, tpmC: 2270.1
progress: 56.1, tpmTOTAL: 4890.9, tpmC: 2271.5
progress: 57.0, tpmTOTAL: 4858.2, tpmC: 2249.2
progress: 58.0, tpmTOTAL: 4809.2, tpmC: 2226.2
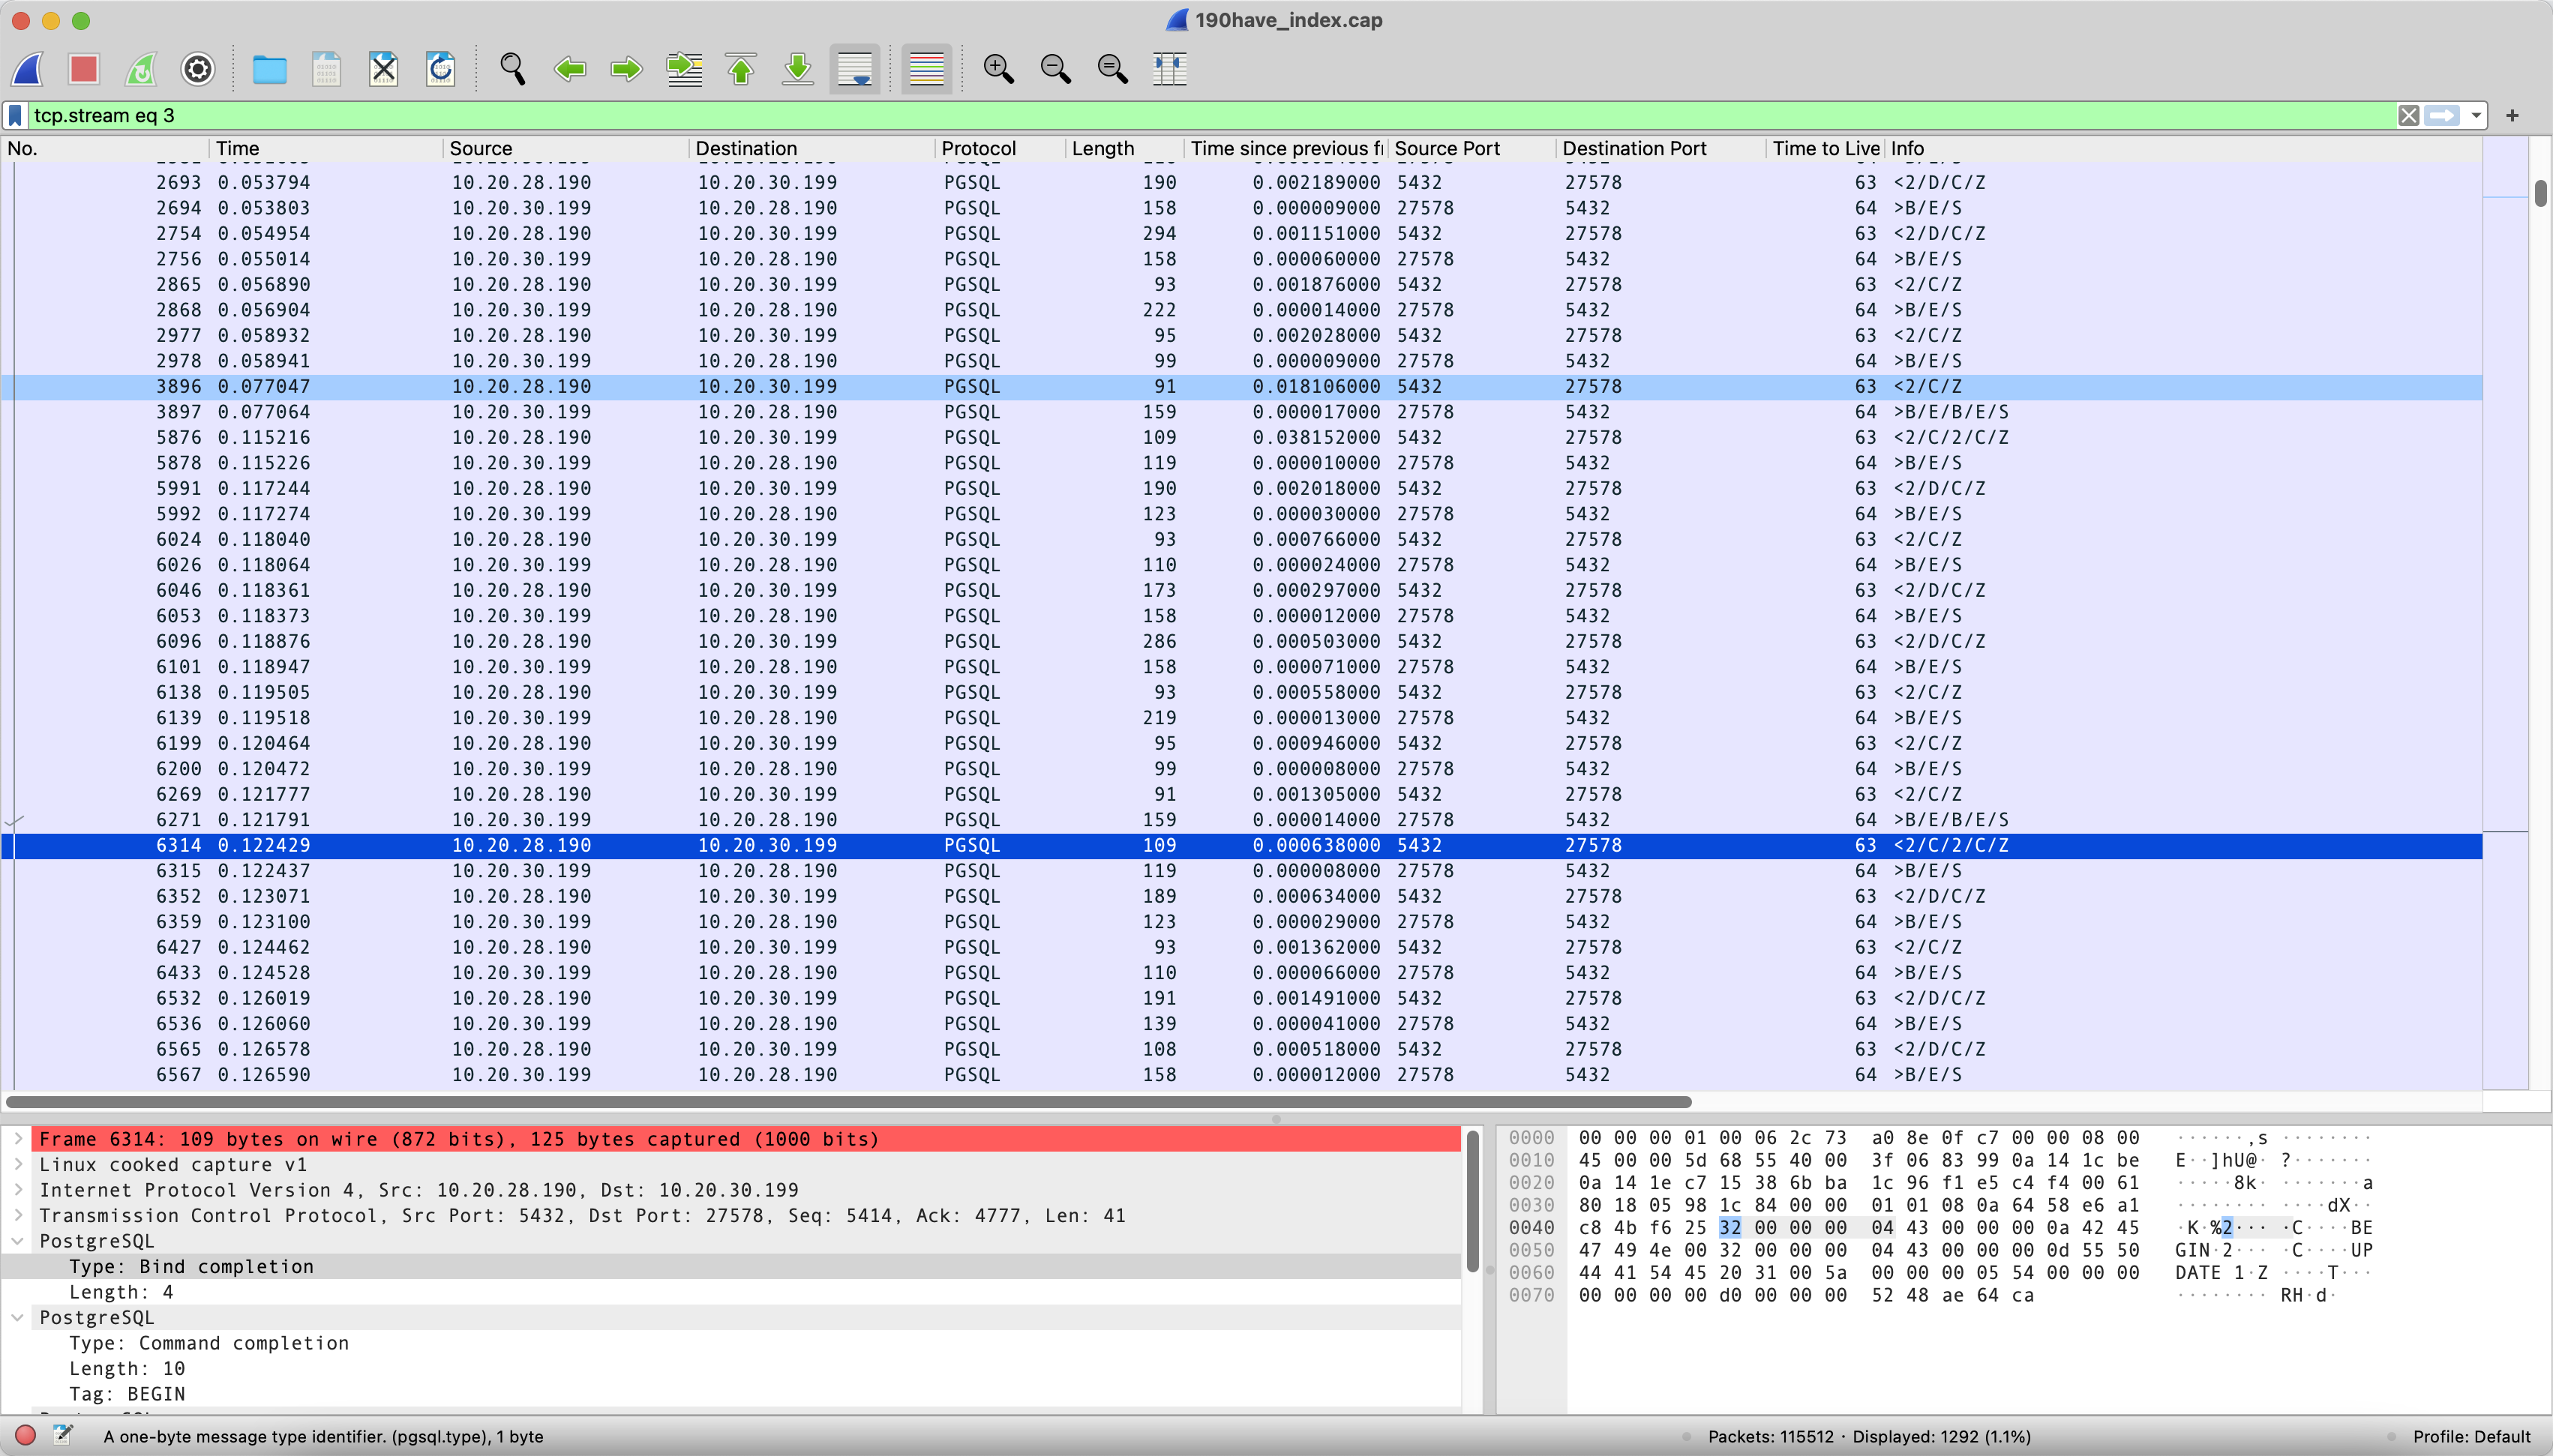
数据包
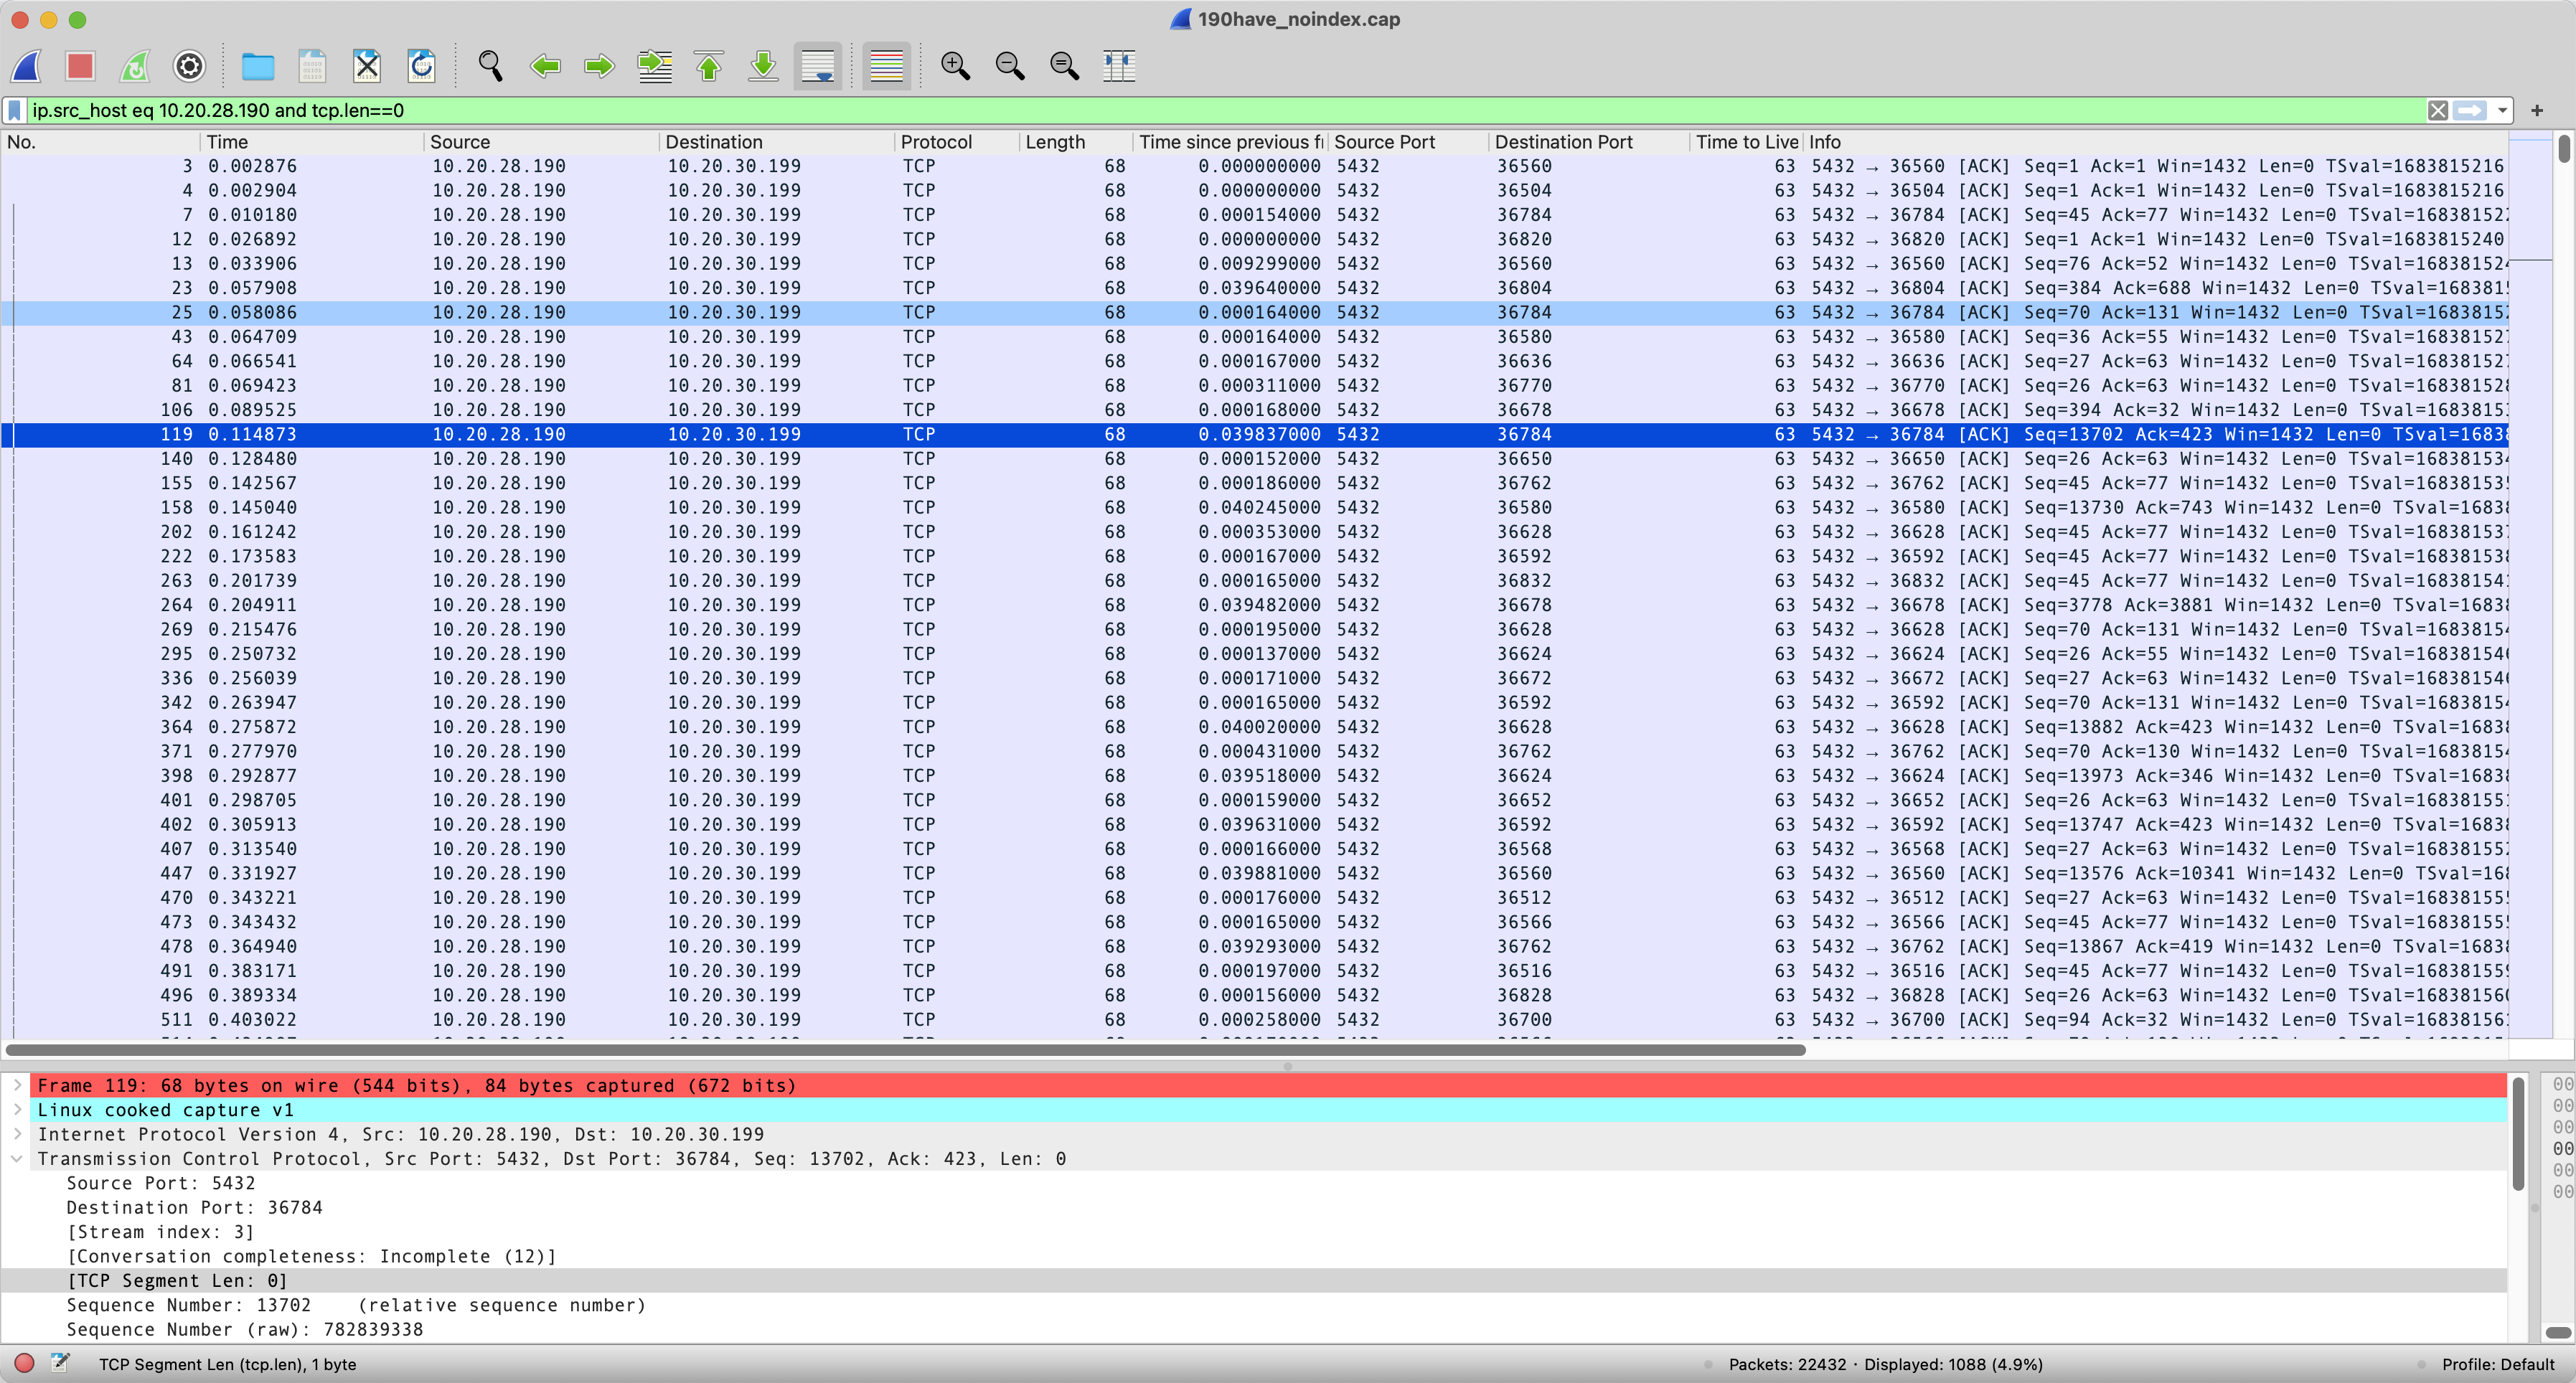
ack包
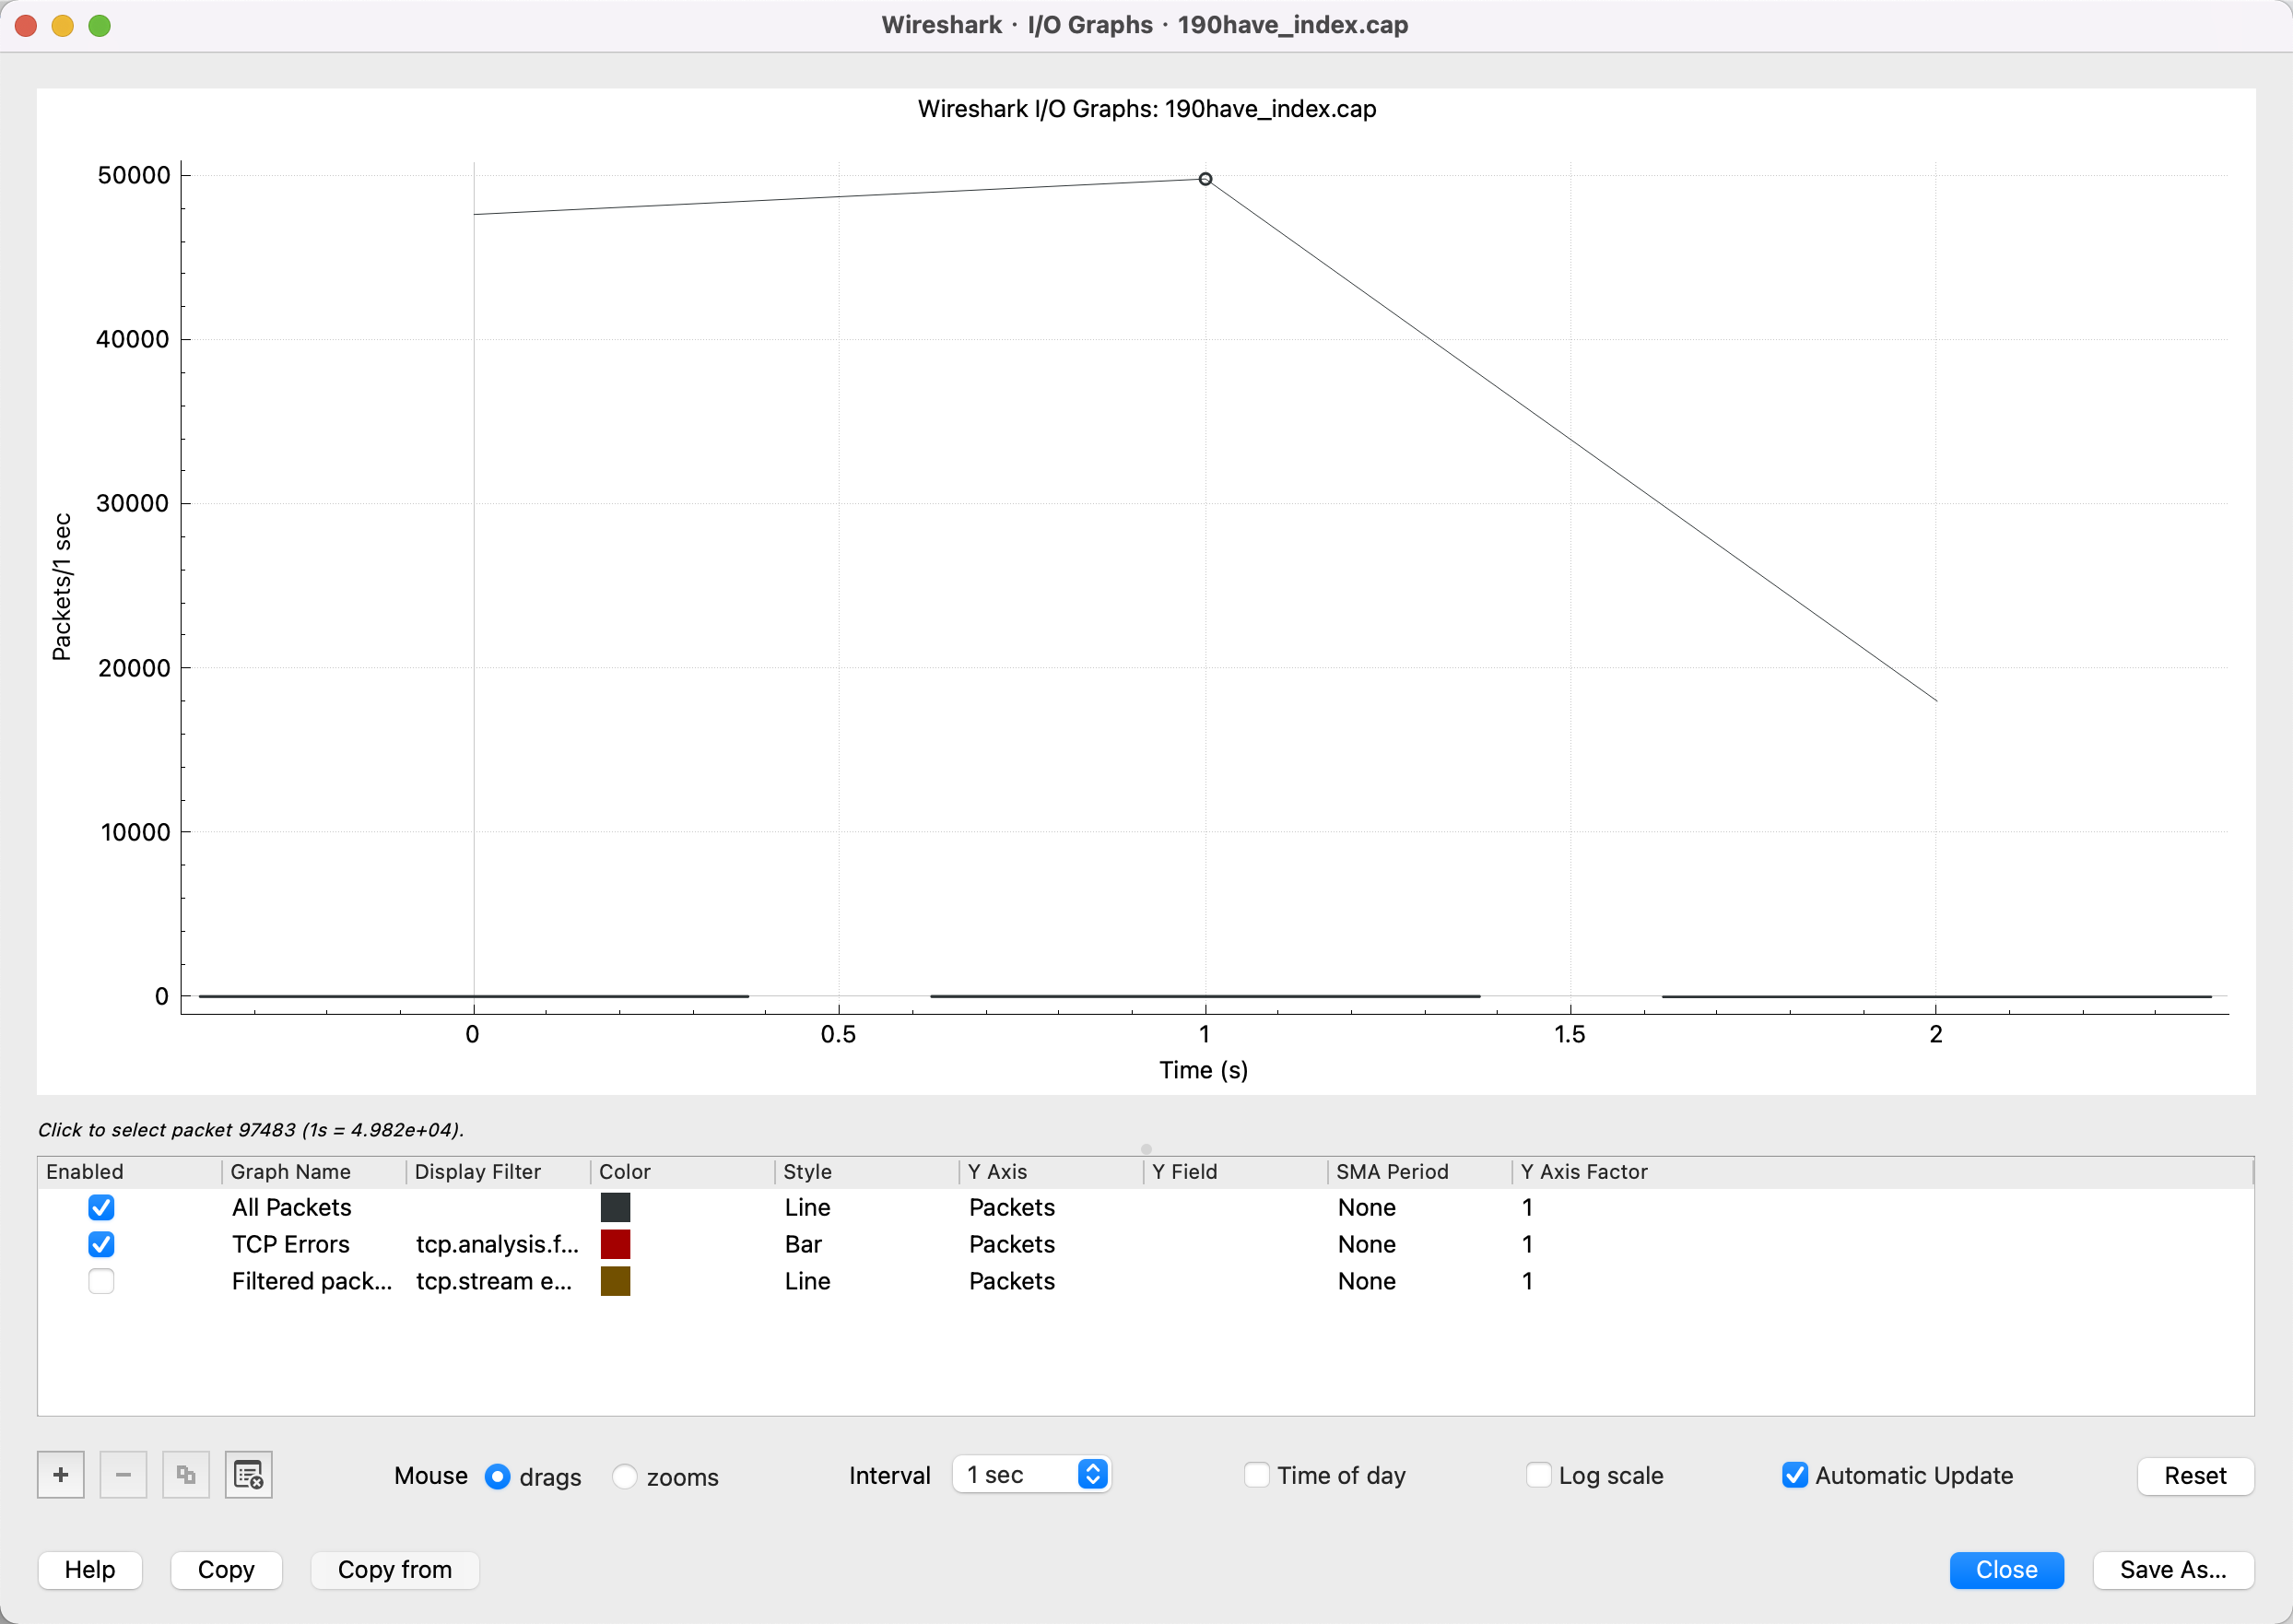
I/O Graphs
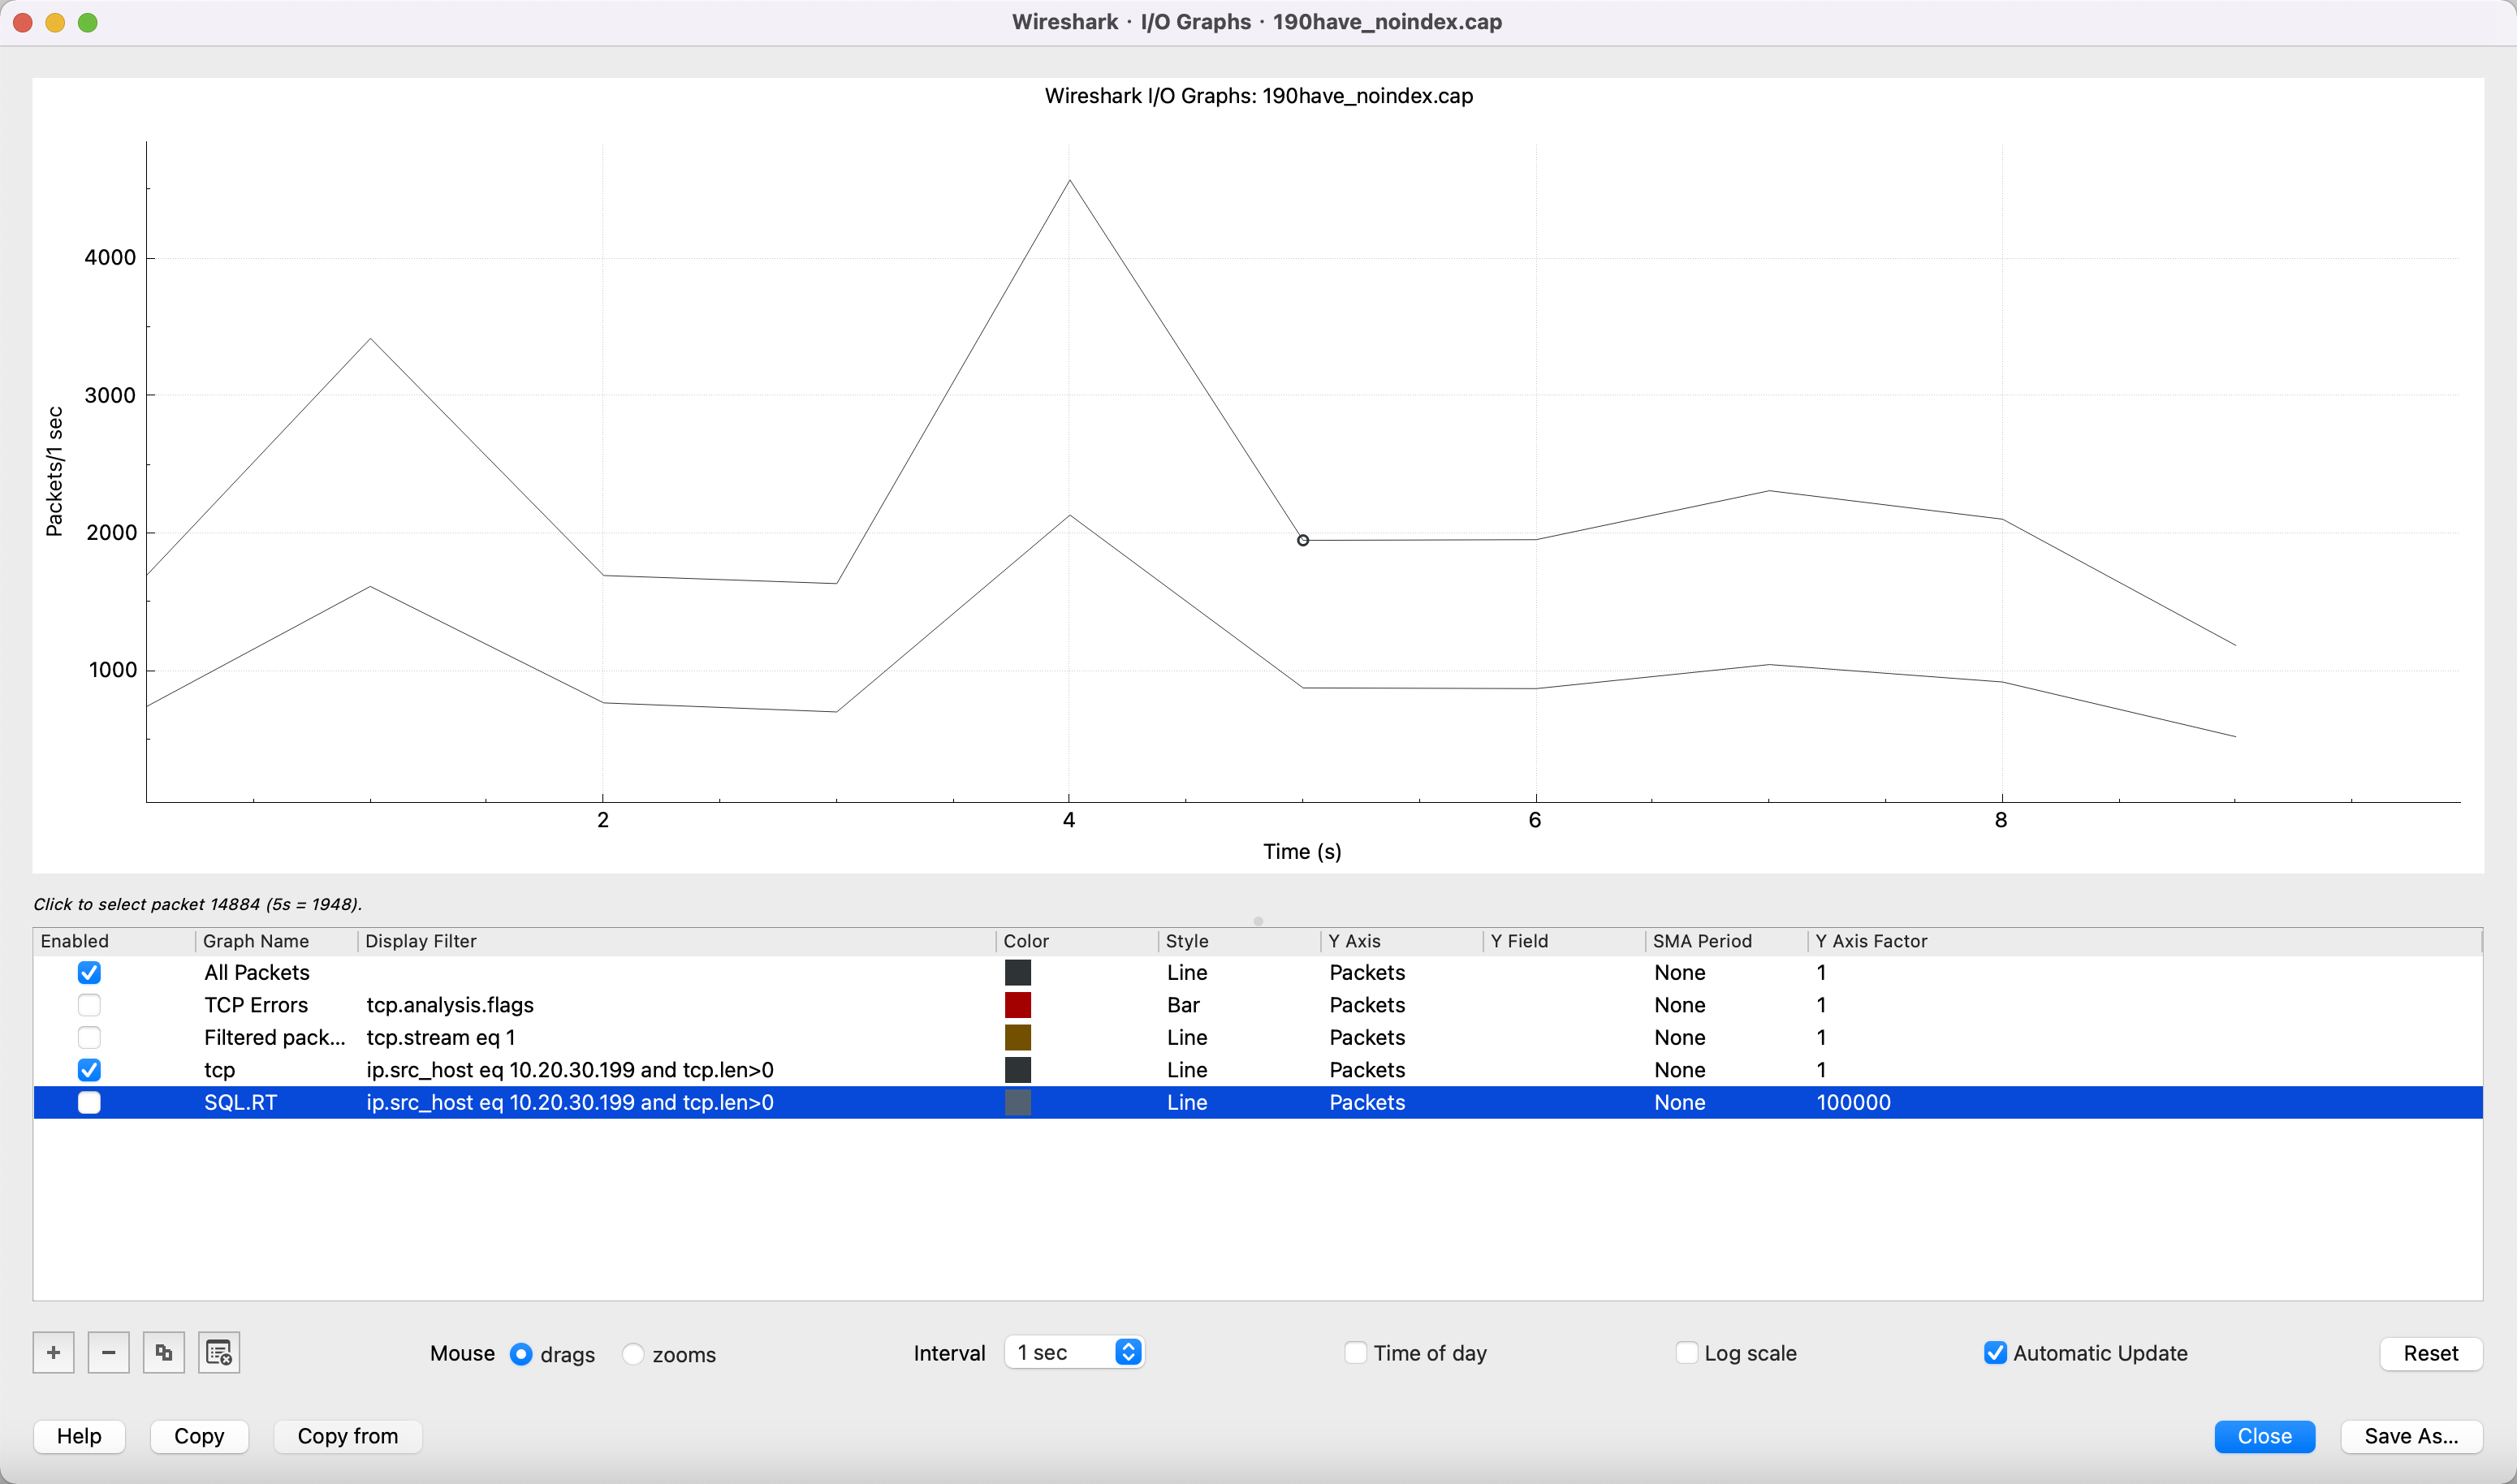
从上图可知:
- 可以得知ttl为64表示抓包机,source Port 36784为bencharksql的端口,5432为数据库的端口,如果源端和目标端不存在跳网,那么只从ttl判断不出谁为数据库或者应用
- 数据库返回给客户端个别的RT达到1秒多,导致整体tpmC为之前的1/10
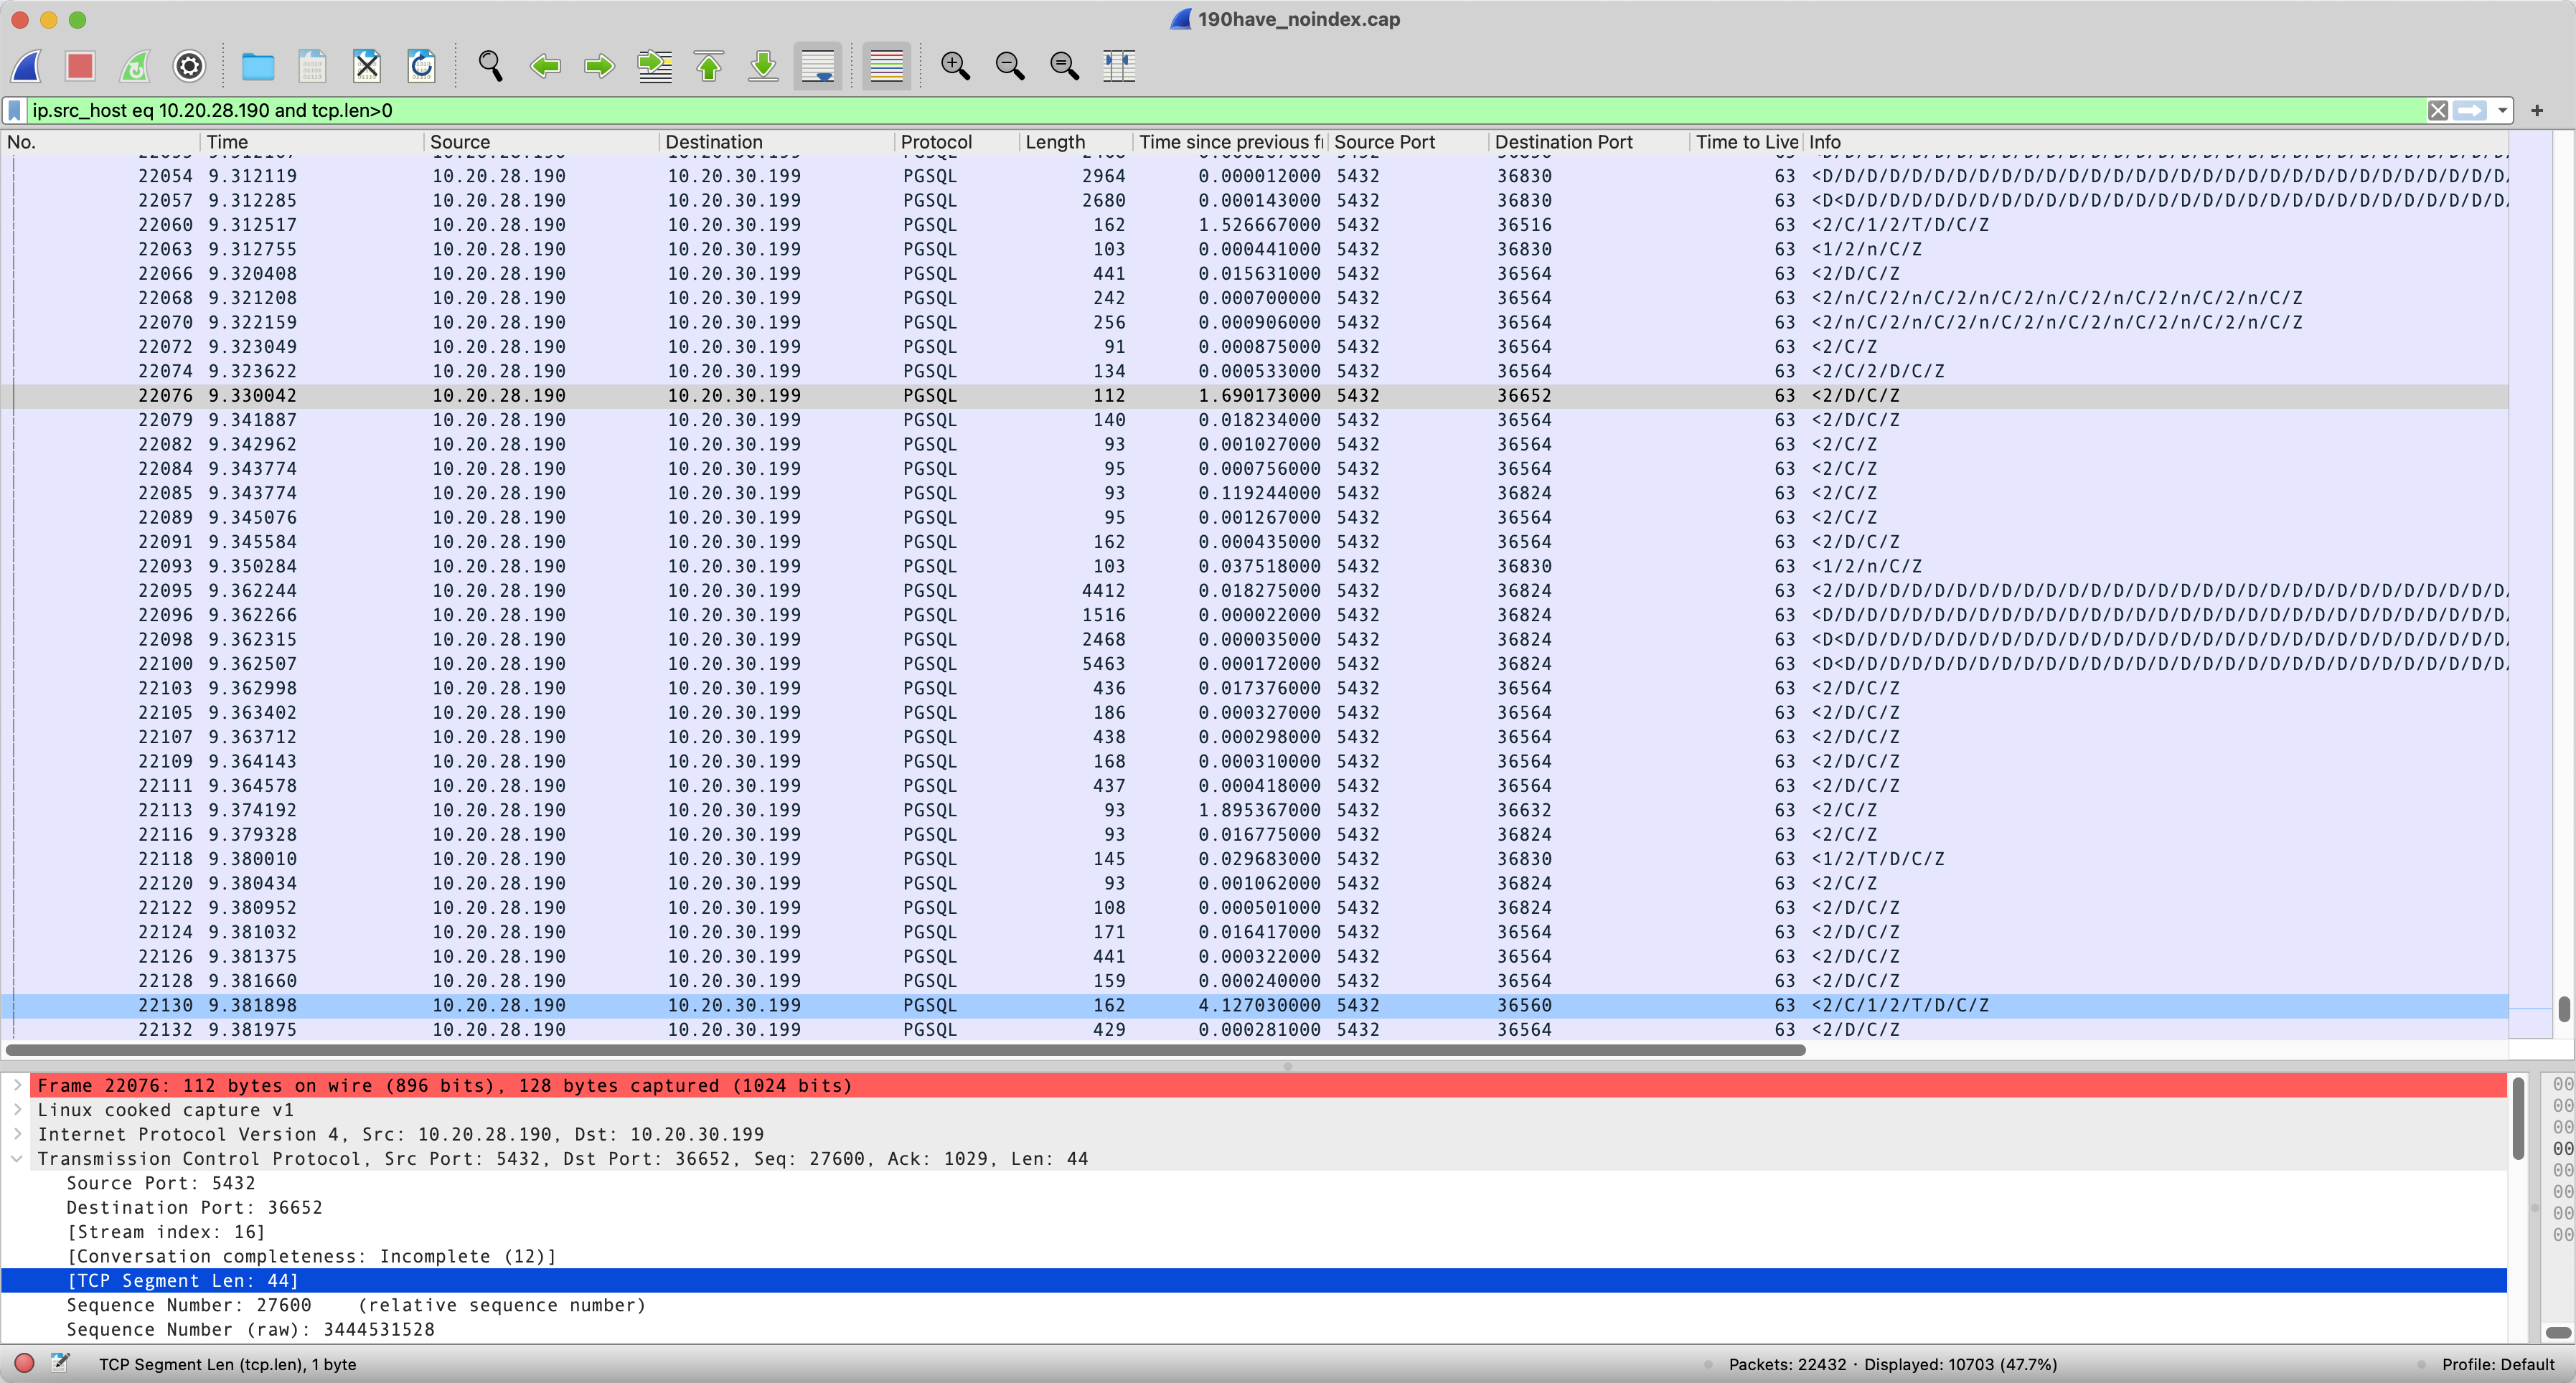
- 从tcp.len>0数据包和tcp.len==0 ack包可以得知,没有索引的情况,表示
疑问
RT响应时长应该是包含网络和SQL的,具体是SQL响应慢还是网络本身慢暂时不能通过wareshark直接看出来吧,只能通过tcp.len==0和>0间接看出来吧
备注:抓包文件
链接: https://pan.baidu.com/s/1y_99b-jsD_bIRaqGZf9ffA?pwd=uctv 提取码: uctv
最后修改时间:2023-11-14 09:51:03
「喜欢这篇文章,您的关注和赞赏是给作者最好的鼓励」
关注作者
【版权声明】本文为墨天轮用户原创内容,转载时必须标注文章的来源(墨天轮),文章链接,文章作者等基本信息,否则作者和墨天轮有权追究责任。如果您发现墨天轮中有涉嫌抄袭或者侵权的内容,欢迎发送邮件至:contact@modb.pro进行举报,并提供相关证据,一经查实,墨天轮将立刻删除相关内容。
