


前言
大家好,今天用AWR来分析存储过程缓慢的问题。
问题原因
开发反映半夜存储过程运行缓慢。每次都是大半夜慢,所以只能部署AWR进行分析。我安装的软件叫pg_profile,不是特别强大,但是分析点慢SQL的问题还是可以的。
首先我们查询pg_stat_activity,可以看到它的存储过程的确挂死了,一直运行很久都出不来。

把锁方面先check一下,排除锁的问题。
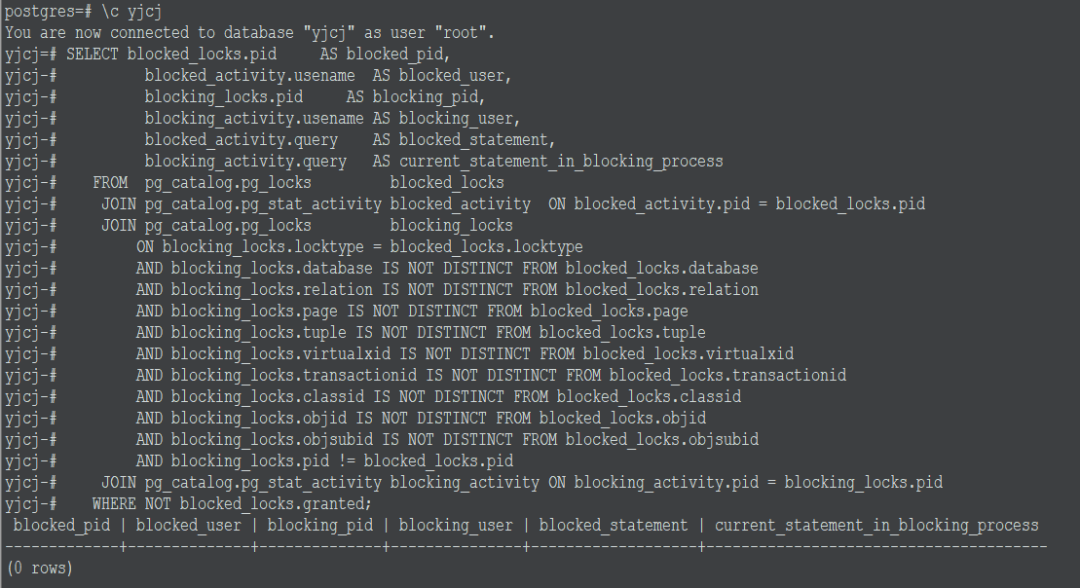
接下来生产awr报告。
psql -U root -p 18802 -d postgres -qtc "select profile.get_report(25,27)" --output awr_report_postgres_25_27.html
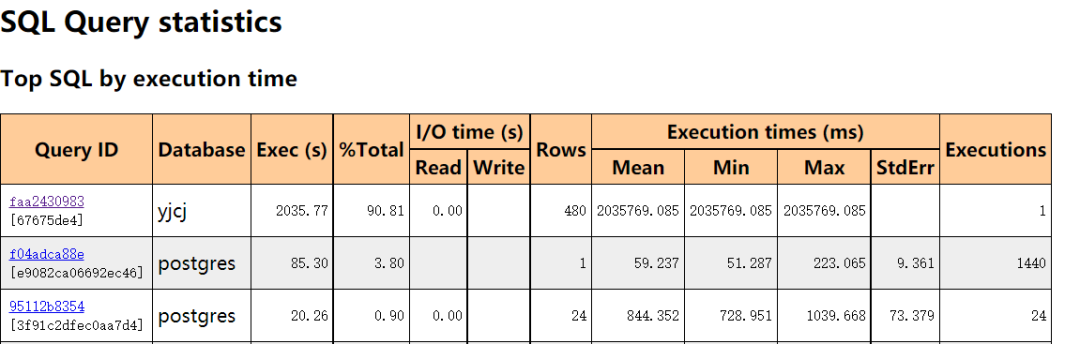
打开AWR报告可以看到这个阶段它的数据库最耗时的SQL就一条。这里你可能会有疑问,怎么不是call这类的语句,因为配置AWR的时候,我们会设置pg_stat_statements.track=all,这个会跟踪嵌套的语句(例如在函数中调用的语句)。
这条sql语句是一个update。
UPDATE TEW_SP_ITV_SERV_ID_TMP1 A SET IS_VALID_SERV_ID = 0 WHERE BILLING_CYCLE_ID = 202104 AND A.LATN_ID = 1010 AND EXISTS (SELECT 1 FROM serv_list_card_flag_JM B WHERE B.card_flag = 99 AND lower(B.service_type) = '/s/o/other' AND A.SERV_ID = B.PROD_INST_ID);
我们把语句拿出来改造成select,查看一下执行计划。
yjcj=> explain analyze select count(1) from TEW_SP_ITV_SERV_ID_TMP1 a WHERE BILLING_CYCLE_ID = 202104 AND A.LATN_ID = 1010 AND EXISTS (SELECT 1 FROM serv_list_card_flag_JM B WHERE B.card_flag = 99 AND lower(B.service_type) = '/s/o/other' AND A.SERV_ID = B.PROD_INST_ID); QUERY PLAN --------------------------------------------------------------------------------------------------------- Aggregate (cost=20020.94..20020.95 rows=1 width=8) (actual time=553795.515..553795.522 rows=1 loops=1) -> Nested Loop Semi Join (cost=10000.43..20020.94 rows=1 width=0) (actual time=23.155..553794.901 rows=480 loops=1) Join Filter: (a.serv_id = b.prod_inst_id) Rows Removed by Join Filter: 101404951 -> Index Scan using i_serv_id_tmp1_1 on tew_sp_itv_serv_id_tmp1 a (cost=0.43..8.44 rows=1 width=8) (actual time=0.067..48.612 rows=5102 loops=1) Index Cond: (latn_id = '1010'::numeric) Filter: (billing_cycle_id = '202104'::numeric) -> Foreign Scan on serv_list_card_flag_jm b (cost=10000.00..20000.00 rows=1000 width=20) (actual time=22.503..104.916 rows=19876 loops=5102) Oracle query: SELECT /*a31ac3da6c424032f46c609eaedbb19c*/ r2."PROD_INST_ID", r2."SERVICE_TYPE", r2."CARD_FLAG" FROM "BILL_JM"."SERV_LIST_CARD_FLAG" r2 WHERE (r2."CARD_FLAG" = 99) AND (lower(r2."SERVICE_TYPE") = '/s/o/other') Planning Time: 3.846 ms Execution Time: 553795.839 ms(11 rows)
和之前分析的一个SQL问题一样,又是万恶的外部表。这里根据前面的条件,查询出5102个结果,然后每个结果调用外部表去查一次,也就是要打开5102次dblink,肯定慢啊。
没办法,只能把enable_nestloop给关闭了,在执行查看。
yjcj=> set enable_nestloop=off;SETyjcj=> explain analyze select count(1) from TEW_SP_ITV_SERV_ID_TMP1 a WHERE BILLING_CYCLE_ID = 202104 AND A.LATN_ID = 1010 AND EXISTS (SELECT 1 FROM serv_list_card_flag_JM B WHERE B.card_flag = 99 AND lower(B.service_type) = '/s/o/other' AND A.SERV_ID = B.PROD_INST_ID); QUERY PLAN --------------------------------------------------------------------------------------------------------- Aggregate (cost=20013.71..20013.72 rows=1 width=8) (actual time=285.712..285.716 rows=1 loops=1) -> Hash Join (cost=20010.95..20013.71 rows=1 width=0) (actual time=276.415..285.654 rows=480 loops=1) Hash Cond: (b.prod_inst_id = a.serv_id) -> HashAggregate (cost=20002.50..20004.50 rows=200 width=20) (actual time=264.509..268.916 rows=21633 loops=1) Group Key: b.prod_inst_id -> Foreign Scan on serv_list_card_flag_jm b (cost=10000.00..20000.00 rows=1000 width=20) (actual time=93.413..253.145 rows=21633 loops=1) Oracle query: SELECT /*a31ac3da6c424032f46c609eaedbb19c*/ r2."PROD_INST_ID", r2."SERVICE_TYPE", r2."CARD_FLAG" FROM "BILL_JM"."SERV_LIST_CARD_FLAG" r2 WHERE (r2."CARD_FLAG" = 99) AND (lower(r2."SERVICE_TYPE") = '/s/o/other') -> Hash (cost=8.44..8.44 rows=1 width=8) (actual time=11.861..11.862 rows=5102 loops=1) Buckets: 8192 (originally 1024) Batches: 1 (originally 1) Memory Usage: 269kB -> Index Scan using i_serv_id_tmp1_1 on tew_sp_itv_serv_id_tmp1 a (cost=0.43..8.44 rows=1 width=8) (actual time=0.124..9.753 rows=5102 loops=1) Index Cond: (latn_id = '1010'::numeric) Filter: (billing_cycle_id = '202104'::numeric) Planning Time: 6.701 ms Execution Time: 286.303 ms
执行时间从553秒下降到286ms,性能简直是指数级的提升。
我们来看看细节。首先它访问tew_sp_itv_serv_id_tmp1表,并通过latn_id这个索引字段过滤出5102条数据。
Index Scan using i_serv_id_tmp1_1 on tew_sp_itv_serv_id_tmp1 a (cost=0.43..8.44 rows=1 width=8) (actual time=0.067..48.612 rows=5102 loops=1)Index Cond: (latn_id = '1010'::numeric) Filter: (billing_cycle_id = '202104'::numeric)
然后它在通过a.serv_id = b.prod_inst_id这个条件进行嵌套循环,执行5102次外部表扫描,就下面这个Oracle query。
Foreign Scan on serv_list_card_flag_jm b (cost=10000.00..20000.00 rows=1000 width=20) (actual time=22.503..104.916 rows=19876 loops=5102) Oracle query: SELECT /*a31ac3da6c424032f46c609eaedbb19c*/ r2."PROD_INST_ID", r2."SERVICE_TYPE", r2."CARD_FLAG" FROM "BILL_JM"."SERV_LIST_CARD_FLAG" r2 WHERE (r2."CARD_FLAG" = 99) AND (lower(r2."SERVICE_TYPE") = '/s/o/other')
所以整个流程走下来就非常慢。如果你直接一次型从Oracle把全部数据取出来做hash运算,那肯定是要比这个快的。所以没办法只好在存储过程中让他们用pg_hint_plan进行绑了。
后记
最后说说存储过程这玩意吧,PG会写和真正懂得用的人感觉很少啊。而且开发直接照搬照套就把Oracle的那一套搬过来。存储过程里面调过程,执行SQL,结果往往会遇到下面的问题。
Transaction control is only possible in CALL or DO invocations from the top level or nested CALL or DO invocations without any other intervening command. For example, if the call stack is CALL proc1() → CALL proc2() → CALL proc3(), then the second and third procedures can perform transaction control actions. But if the call stack is CALL proc1() → SELECT func2() → CALL proc3(), then the last procedure cannot do transaction control, because of the SELECT in between.
在存储过程中如果你是执行CALL proc1(),在执行select func2() ,在执行CALL proc3()的话,最后一个是不能做事务控制的。
好了,最终建议是搞个ETL的工具去替换存储过程,不要在数据库里面搞这么多复杂逻辑。
