


0x01 Prometheus 安装异常整理
问题1.访问node_exporter程序的9100的/metrics提示context deadline exceeded错误
问题2.采用Docker进行prometheus server端安装报
msg="Failed to create directory for logging active queries"
错误;问题3.安装运行prometheus_server端时显示
This filesystem is not supported and may lead to data corruption and data loss
警告。问题4.使用Prometheus监控外部k8s集群时提示
x509: certificate signed by unknown authority
错误问题5.使用Prometheus监控外部k8s集群时提示
cannot list resource \"services\" in API group
错误0x02 Prometheus 使用异常整理
问题1.Warning: Error fetching server time: Detected 82.30200004577637 seconds time difference between your browser and the server.
问题2.在启动postgres_exporter监测失败
0x03 AlertManager 使用异常整理
问题1.配置使用企业邮箱进行报警时显示
email.loginAuth failed: 530 Must issue a STARTTLS command first
错误问题2.配置使用企业邮箱进行报警时显示
starttls failed: x509: certificate signed by unknown authority
错误问题3.邮件预警配置时遇到的错误记录
问题4.邮件预警配置使用时报
notify retry canceled after 2 attempts: *email.loginAuth auth: 535 Error:
错误信息。
0x01 Prometheus 安装异常整理
问题1.访问node_exporter程序的9100的/metrics提示context deadline exceeded错误
异常信息:Get http://192.168.90.177:9100/metrics: context deadline exceeded
问题原因: 有可能是系统端口未开放。
解决办法:指定其他端口或者更改防火墙访问策略。
# 解决方式1
nohup ./node_exporter  --web.listen-address=":9100" &

# 解决方式2
# CentOS
firewall-cmd --zone=public --add-port=9100/tcp --permanent #永久生效没有permanent参数重启后失效
firewall-cmd --reload #重新载入配置生效
# Ubuntu
sudo ufw allow 9100
问题2.采用Docker进行prometheus server端安装报msg="Failed to create directory for logging active queries"
错误;
异常信息: 在持久化映射目录下没有
prometheus.yml
文件因此会被临时创建一个目录文件导致出错或者因为持久化的数据目录权限问题。
$ docker logs prometheus_server
  # prometheus_server | level=error ts=2021-04-30T07:50:11.241Z caller=query_logger.go:109 component=activeQueryTracker msg="Failed to create directory for logging active queries"
  # prometheus_server | level=error ts=2021-04-30T07:50:11.241Z caller=query_logger.go:87 component=activeQueryTracker msg="Error opening query log file" file=data/queries.active err="open data/queries.active: no such file or directory"
  # prometheus_server | panic: Unable to create mmap-ed active query log
  # component=activeQueryTracker msg="Error opening query log file" file=/prometheus/queries.active err="open prometheus/queries.active: permission denied"
# panic: Unable to create mmap-ed active query log
解决办法: 在映射的持久化目录下创建
prometheus.yml
文件并进行相应权限配置。
chmod +777 nfsdisk-31/monitor/prometheus
docker run -p 9090:9090 -v tmp/prometheus.yml:/etc/prometheus/prometheus.yml \
  -v nfsdisk-31/monitor/prometheus:/prometheus \
  prom/prometheus
Tips : 注意 Prometheus 2.x 版本容器的数据目录是/prometheus而非/prometheus-data
目录;
问题3.安装运行prometheus_server端时显示This filesystem is not supported and may lead to data corruption and data loss
警告。
异常信息: 由于prometheus包括本地磁盘时间序列数据库,但也可以选择与远程存储系统集成,此文件系统不受支持可能导致数据损坏和数据丢失。
prometheus_server | level=warn ts=2021-05-10T05:46:49.843Z caller=main.go:813 fs_type=NFS_SUPER_MAGIC msg="This filesystem is not supported and may lead to data corruption and data loss. Please carefully read https://prometheus.io/docs/prometheus/latest/storage/ to learn more about supported filesystems."
异常原因: Prometheus的本地存储不支持不兼容POSIX的文件系统,因为可能会发生不可恢复的损坏。不支持NFS文件系统(包括AWS的EFS)。NFS可能符合POSIX,但大多数实现均不符合。强烈建议使用本地文件系统以提高可靠性,所以此种共享存储文件的方式不推荐。
解决办法: 如果您的本地存储由于某种原因而损坏,解决该问题的最佳策略是关闭Prometheus,然后删除整个存储目录,您也可以尝试删除单个块目录或WAL目录以解决问题。如果数据没问题只是报警你使用了NFS共享存储文件的格式建议采用FC SAN 存储直连
或者加大磁盘存储空间。
问题4.使用Prometheus监控外部k8s集群时提示 x509: certificate signed by unknown authority
错误
异常信息:
prometheus_server | level=error ts=2021-05-10T05:43:12.126Z caller=klog.go:96 component=k8s_client_runtime func=ErrorDepth msg="pkg/mod/k8s.io/client-go@v0.20.5/tools/cache/reflector.go:167: Failed to watch *v1.Pod: failed to list *v1.Pod: Get \"https://k8s-dev.weiyigeek:6443/api/v1/pods?limit=500&resourceVersion=0\": x509: certificate signed by unknown authority"
解决办法: 在prometheus.yaml主配置中在kubernetes_sd_file对象内的使用insecure_skip_verify: true
来跳过 tls 验证。
tls_config:
  insecure_skip_verify: true
问题5.使用Prometheus监控外部k8s集群时提示cannot list resource \"services\" in API group
错误
异常信息:
prometheus_server | level=error ts=2021-05-10T09:09:30.960Z caller=klog.go:96 component=k8s_client_runtime func=ErrorDepth msg="pkg/mod/k8s.io/client-go@v0.20.5/tools/cache/reflector.go:167: Failed to watch *v1.Service: failed to list *v1.Service: services is forbidden: User \"system:serviceaccount:default:prometheus\" cannot list resource \"services\" in API group \"\" at the cluster scope"
问题原因: 当前Token所属prometheus用户无该services查看浏览权限需要在ClsuterRole
进行添加相对应的权限。
kubectl get clusterrole prometheus -o yaml # 采用yaml格式查看其权限集群角色权限
  # NAME         CREATED AT
  # prometheus   2021-05-14T08:29:08Z
0x02 Prometheus 使用异常整理
问题1.Warning: Error fetching server time: Detected 82.30200004577637 seconds time difference between your browser and the server.
异常信息: 服务器时间:检测到您的浏览器和服务器之间有82.30200004577637秒的时间差。Prometheus依赖于精确的时间,而时间漂移可能会导致意外的查询结果。
问题原因: 服务器的时间与本地时间不一致从而导致, PS 在 Prometheus web 中偏差大于 5 min 时,无法查询到任何数据,当时间偏差小于 5min 时,可以查到数据,并且正常在 Grafana 中显示。
解决办法: 服务器时间与本机时间设置一致即可;

问题2.在启动postgres_exporter监测失败
解决办法: 在启动postgres_exporter的Linux用户下加入DATA_SOURCE_NAME
环境变量
# 环境变量添加
tee -a ~/.bash_profile <<'EOF'
export DATA_SOURCE_NAME="postgresql://postgres:postgres@127.0.0.1:5432/postgres?sslmode=disable"
EOF

# 环境变量生效
source .bash_profile && echo $DATA_SOURCE_NAME

# 启动 postgres 导出器
./postgres_exporter
0x03 AlertManager 使用异常整理
问题1.配置使用企业邮箱进行报警时显示email.loginAuth failed: 530 Must issue a STARTTLS command first
错误
问题原因: 接入的邮件服务器必须使用tls并且进行有效身份校验。
解决办法:
smtp_require_tls: true
问题2.配置使用企业邮箱进行报警时显示starttls failed: x509: certificate signed by unknown authority
错误
问题原因: 未知机构签署的证书即客户端访问服务端时证书不受信赖
解决办法: 需要在 email_configs
下配置 insecure_skip_verify: true 来跳过 tls 验证
receivers:
- name: 'default-email'
  email_configs:
  - to: 'master@weiyigeek.top'
    insecure_skip_verify: true
    send_resolved: true
问题3.邮件预警配置时遇到的错误记录
# - 当在global配置 smtp.weiyigeek.top:25
报错信息:
level=error ts=2020-04-08T06:02:44.036Z caller=notify.go:372 component=dispatcher msg=“Error on notify” err=“send STARTTLS command: x509: certificate is valid for *.mxhichina.com, mxhichina.com, not smtp.weiyigeek.top” context_err=“context deadline exceeded”
level=error ts=2020-04-08T06:02:44.036Z caller=dispatch.go:301 component=dispatcher msg=“Notify for alerts failed” num_alerts=1 err=“send STARTTLS command: x509: certificate is valid for *.mxhichina.com, mxhichina.com, not smtp.weiyigeek.top”

# - 当在global配置
# smtp.weiyigeek.top
# smtp_require_tls:false
报错信息:
level=warn ts=2020-10-12T10:34:11.780Z caller=notify.go:674 component=dispatcher receiver=mail-receiver integration=email[0] msg=“Notify attempt failed, will retry later” attempts=1 err="*smtp.plainAuth auth: unencrypted connection"
level=error ts=2020-10-12T10:34:21.581Z caller=dispatch.go:309 component=dispatcher msg=“Notify for alerts failed” num_alerts=1 err=“mail-receiver/email[0]: notify retry canceled after 7 attempts: *smtp.plainAuth auth: unencrypted connection”

# - 配置smtp.qiye.aliyun.com:465
报错信息:
level=warn ts=2020-10-12T11:36:41.779Z caller=notify.go:674 component=dispatcher receiver=mail-receiver integration=email[0] msg=“Notify attempt failed, will retry later” attempts=1 err="‘require_tls’ is true (default) but “smtp.qiye.aliyun.com:465” does not advertise the STARTTLS extension"
level=error ts=2020-10-12T11:36:51.578Z caller=dispatch.go:309 component=dispatcher msg=“Notify for alerts failed” num_alerts=1 err=“mail-receiver/email[0]: notify retry canceled after 8 attempts: ‘require_tls’ is true (default) but “smtp.qiye.aliyun.com:465” does not advertise the STARTTLS extension”tail: opt/logs/alertmanager-9093.log: file truncated
解决办法: 配置以下两行发送邮件正常
smtp.qiye.aliyun.com:465
smtp_require_tls: false
问题4.邮件预警配置使用时报notify retry canceled after 2 attempts: *email.loginAuth auth: 535 Error:
错误信息。
错误信息:
level=error ts=2021-05-20T14:34:43.637Z caller=dispatch.go:309 component=dispatcher msg="Notify for alerts failed" num_alerts=2 err="default-email/email[0]: notify retry canceled after 2 attempts: *email.loginAuth auth: 535 Error: \ufffd\ufffdʹ\ufffd\ufffd\ufffd\ufffdȨ\ufffd\ufffd\ufffd\ufffd¼\ufffd\ufffd\ufffd\ufffd\ufffd\ufffd\ufffd뿴: http://service.mail.qq.com/cgi-bin/help?subtype=1&&id=28&&no=1001256"
错误原因: 邮箱认证密码未采用用于登录第三方客户端的专用密码或者设置的tmpl模板路径不正确,此时只需按照上述的地址进行申请发信邮箱的专用密码。(实际测试发现QQ邮箱必须要使用第三方专用密码,而企业邮箱可以直接用登陆密码进行认证不推荐
)
0x00 前言简述
0x01 AlertManager之邮件告警
1.配置并使用腾讯企业邮箱进行邮件发送警告
2.配置并使用自定义邮箱报警样式模板
3.配置并使用企业微信发送报警通知
0x02 实现Prometheus安全认证配置
0x00 前言简述
描述: Prometheus 告警分为两个部分进行实现监控规则匹配以及告警信息的通知。
首先需要在
Prometheus
中添加告警规则,定义告警产生的逻辑。其次
Alertmanager
系统将触发的警报转化为通知,例如邮件、呼叫和聊天消息。
告警状态
Prometheus Alert 告警状态有三种状态:Inactive、Pending、Firing
。
Inactive:非活动状态,表示正在监控,但是还未有任何警报触发。
Pending:表示这个警报必须被触发。由于警报可以被分组、压抑/抑制或静默/静音,所以等待验证,一旦所有的验证都通过,则将转到 Firing 状态。
Firing:将警报发送到 AlertManager,它将按照配置将警报的发送给所有接收者。一旦警报解除则将状态转到 Inactive如此循环。
参考来源
https://prometheus.io/docs/alerting/configuration/
0x01 AlertManager之邮件告警
描述: 在前面几章的学习中都没有讲解AlertManager报警管理系统的使用,博主专门把他放在本章进行讲解,因为其实现报警通知的方式有多种多样。
Email_config 配置参考: https://prometheus.io/docs/alerting/latest/configuration/#email_config
# - 注意此处非全局所以没有smtp前缀
# Whether or not to notify about resolved alerts.
[ send_resolved: <boolean> | default = false ]

# The email address to send notifications to.
to: <tmpl_string>

# The sender address.
[ from: <tmpl_string> | default = global.smtp_from ]

# The SMTP host through which emails are sent.
[ smarthost: <string> | default = global.smtp_smarthost ]

# The hostname to identify to the SMTP server.
[ hello: <string> | default = global.smtp_hello ]

# SMTP authentication information.
[ auth_username: <string> | default = global.smtp_auth_username ]
[ auth_password: <secret> | default = global.smtp_auth_password ]
[ auth_secret: <secret> | default = global.smtp_auth_secret ]
[ auth_identity: <string> | default = global.smtp_auth_identity ]

# The SMTP TLS requirement.
# Note that Go does not support unencrypted connections to remote SMTP endpoints.
[ require_tls: <bool> | default = global.smtp_require_tls ]

# TLS configuration.
tls_config:
  [ <tls_config> ]

# The HTML body of the email notification.
[ html: <tmpl_string> | default = '{{ template "email.default.html" . }}' ]
# The text body of the email notification.
[ text: <tmpl_string> ]

# Further headers email header key/value pairs. Overrides any headers
# previously set by the notification implementation.
[ headers: { <string>: <tmpl_string>, ... } ]
实践目标:
1.配置并使用腾讯企业邮箱进行邮件发送警告
2.配置并使用自定义邮箱报警样式模板
3.配置并使用企业微信发送报警通知
1.配置并使用腾讯企业邮箱进行邮件发送警告
Step 1.首先我们需要配置 Prometheus.yml 抓取目标、加载规则文件,并与Alertmanager通信设置。
global:
  scrape_interval: 2m
  scrape_timeout: 10s
  # - 每分钟进行报警规则的评估 (建议根据实际情况进行修改)
  evaluation_interval: 1m
  external_labels:
    monitor: 'prom-demo'

alerting:
  # - 设置报警管理系统的目标地址 (可以配置多个AlertManager)
  alertmanagers:
  - scheme: http
    static_configs:
    - targets:
      - '192.168.12.107:30093'

rule_files:
  # - 指标监控告警规则 (可以根据不同的场景进行报警规则)
  - etc/prometheus/conf.d/rules/*.rules

  # - 采集监控的静态目标和自动化发现目标
scrape_configs:
  - job_name: 'prom-Server'
    static_configs:
      - targets: ['localhost:9090']
  - job_name: 'cAdvisor'
    static_configs:
      - targets: ['192.168.12.111:9100']
  - job_name: 'linux_exporter'
    scrape_interval: 30s
    file_sd_configs:
    - files:
      - etc/prometheus/conf.d/discovery/k8s_nodes.yaml
      # - 自动刷新自动发现配置文件
      refresh_interval: 1m
Step 2.配置 Prometheus 报警规则此次判断采集节点的状态和节点主机负载情况
tee alert.rules <<'EOF'
groups:
- name: node-normal
  rules:
  - alert: service_down
    expr: up {job="linux_exporter"} == 0
    # - 对于持续时间的设置在实际环境中至少建议5min,以减少噪声从而减轻固有监控各种情况,此处设置为30s便于报警情况的观察。
    for: 30s
    labels:
      severity: 'critical'
      team: node
    annotations:
      summary: "主机 {{ $labels.instance }} 监控服务已停止运行超过 15s!"
      description: "请系统管理员尽快进行人工干预处理!"
  - alert: high_load
    expr: node_load1 > 0.7
    for: 5m
    labels:
      severity: 'warning'
      team: node
    annotations:
      summary: "主机 {{ $labels.instance }} 高负载大于0.7以上运行超过 5m!"
EOF
Tips
: 说明一下该 rules 目的是监测 node 是否存活 expr 为 PromQL 表达式验证特定节点
job="linux_exporter" 是否活着,for 表示报警状态为 Pending 后等待 30s 变成 Firing 状态,一旦变成
Firing 状态则将报警发送到 AlertManager 并且 labels (标签
)和 annotations(注释
) 对该 alert 添加更多的标识和注解信息。
Step 3.配置 Alertmanager 报警通知,此时配置腾讯企业邮箱的方式进行邮件发送报警。
tee alertmanager.yaml <<'EOF'
# - 全局配置
global:
  resolve_timeout: 5m
  smtp_from: 'monitor@weiyigeek.top'
  # - 企业邮箱 SMTP 服务地址
  smtp_smarthost: 'smtp.exmail.qq.com:465'
  smtp_auth_username: 'monitor@weiyigeek.top'
  # - 第三方登录企业邮箱的授权码
  smtp_auth_password: xxxxxxxxxxx'
  smtp_require_tls: false
  # smtp_hello: 'qq.com'
# - 设置报警的分发策略
route:
  group_by: ['alertname']
  group_wait: 30s
  group_interval: 1m
  # - 如果在10分钟内还未解除报警则进行发送告警
  repeat_interval: 10m
  receiver: 'default-email'
# -  配置告警消息接受者信息
receivers:
- name: 'default-email'
  email_configs:
  - to: 'master@weiyigeek.top'
    send_resolved: true
# - 抑制规则配置
inhibit_rules:
  - source_match:
      severity: 'critical'
    target_match:
      severity: 'warning'
    equal: ['alertname', 'instance']
EOF
Step 4.重启Prometheus和Alertmanager服务,同时关闭一台node进行触发报警发送 Email,上边我们定义的 rule 规则为监测 job="linux_exporter" Node 是否活着,那么就可以停掉 node-exporter 服务来间接起到 Node Down 的作用,从而达到报警条件,触发报警规则。
# - 重启容器
docker restart prometheus_alertmanager prometheus_server

# - 关闭192.168.12.109机器的node_exporter服务
ssh -p 20211 weiyigeek@weiyigeek-109 "sudo -S systemctl stop node_exporter.service"
[sudo] password for weiyigeek:
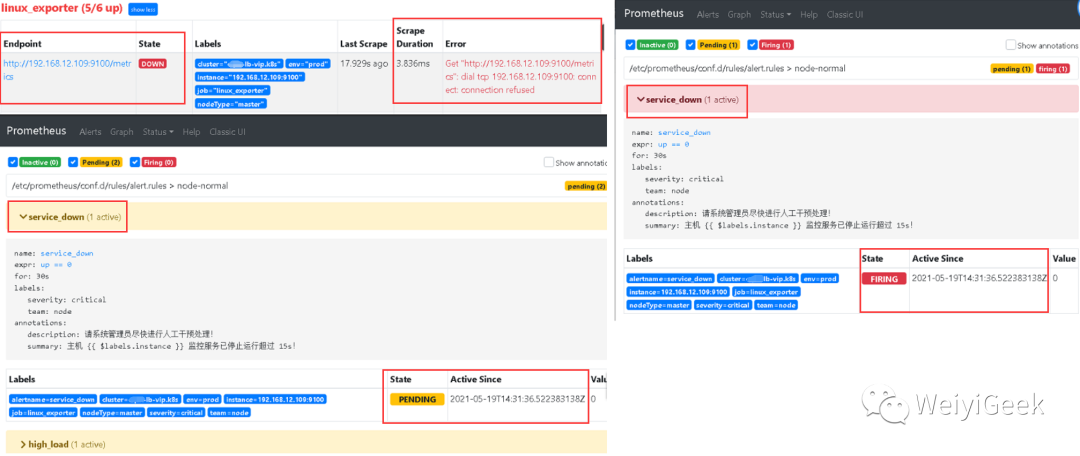
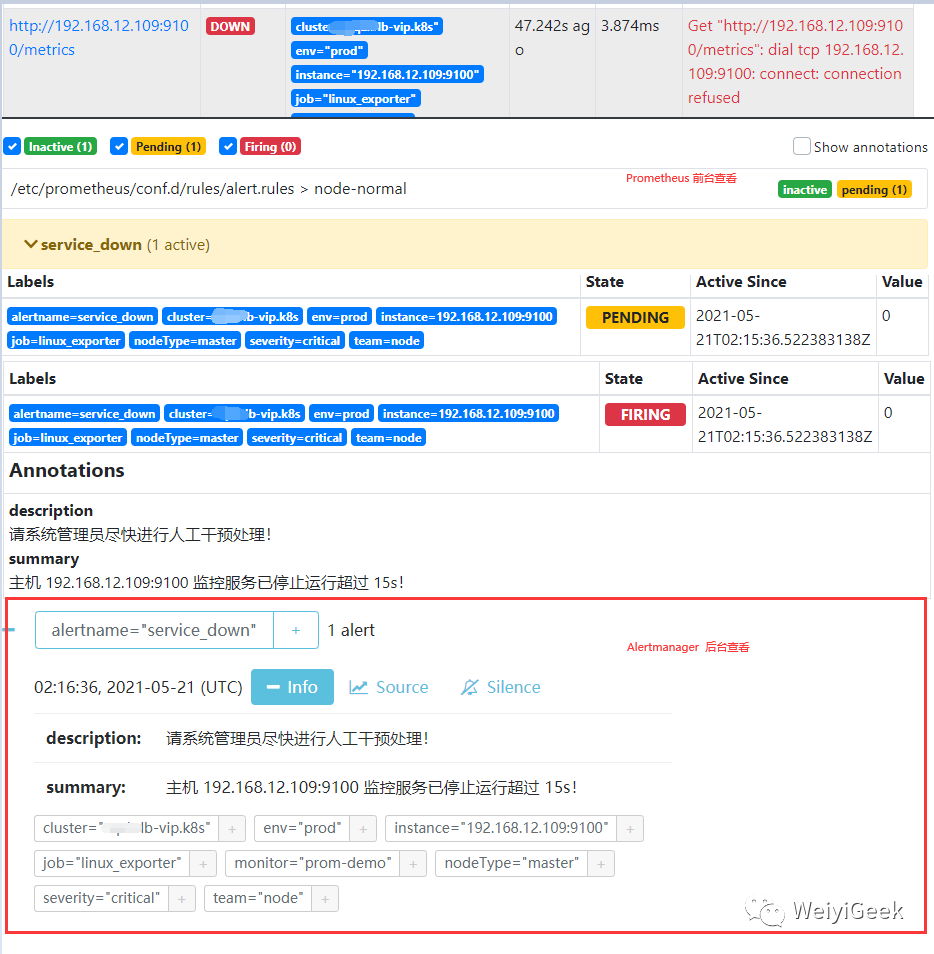
Step 5.效果查看及报警流程说明,关闭后等待prometheus定时拉取各job的任务执行,其次我们可以在
Targets
刷新查看linux_exporter
任务中状态为 unhealthy192.168.12.109
的节点状态是否变成了DOWN,等待 30s 后,alert 页面由绿色 Service_down (0 active) Inactive 状态变成了黄色 Service_down (1 active) Pending 状态,继续等待 30s 后状态变成红色 Firing 状态,向 AlertManager 发送报警信息,此时 AlertManager 则按照配置规则向接受者发送邮件告警。
linux_exporter (5/6 up)
Endpoint	State	 Error
http://192.168.12.109:9100/metrics	DOWN	Get "http://192.168.12.109:9100/metrics": dial tcp 192.168.12.109:9100: connect: connection refused
Step 6.我们在 AlertManager 查看发送报警信息以及发送的报警邮箱,可以看到接收到的报警包含该节点的标签以及我们添加的
Annotations
注释信息。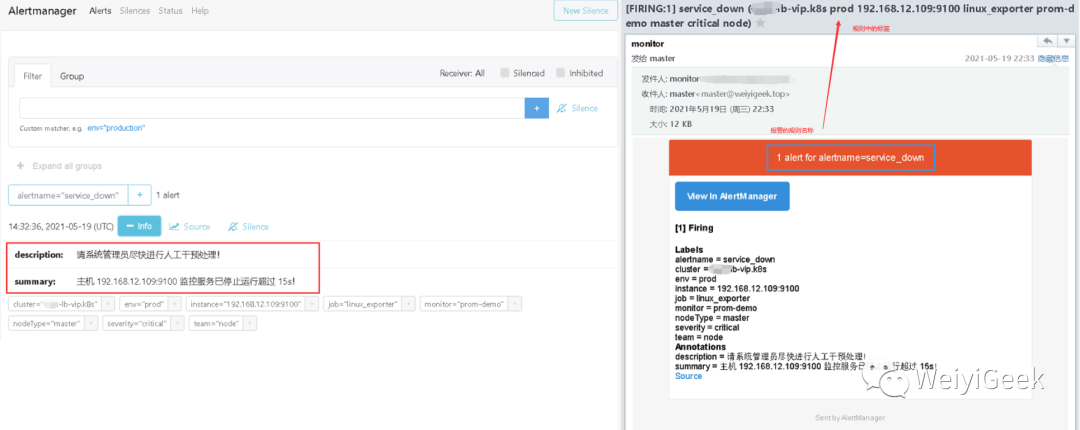
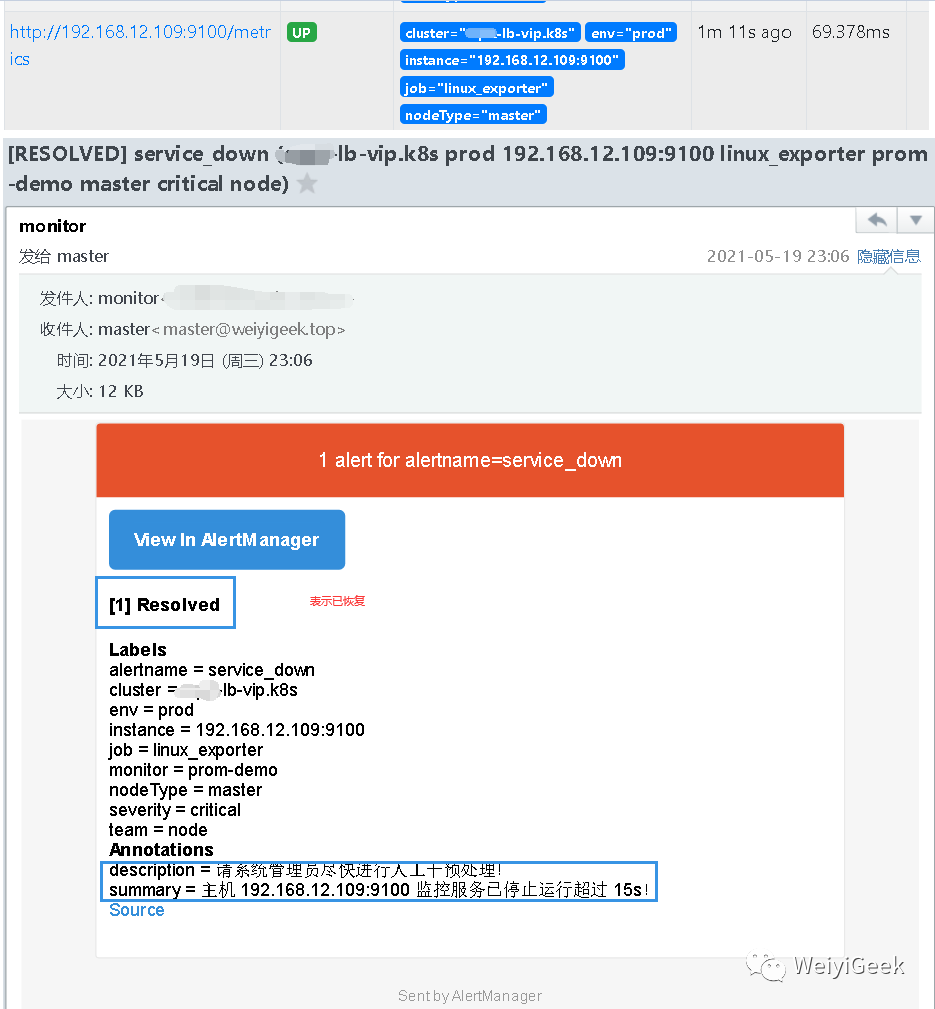
Step 7.然后我们将
192.168.12.109
机器的linux_exporter服务进行开启查看其恢复以及警报解除情况。在等待 30s 之后,Prometheus Alerts 页面变成绿色Service_down (0 active) Inactive
状态,同时也收到了报警解除邮件提醒。
ssh -p 20211 weiyigeek@weiyigeek-109 "sudo -S systemctl start node_exporter.service"
Tips : 每次停止/恢复服务后 30s 之后才会发现 Alert 状态变化,是因为 prometheus.yml中 global -> scrape_interval: 30s 配置决定的,如果觉得等待 30s 时间太长,可以修改小一些可以全局修改,也可以局部修改。例如s上面就行采用局部修改 linux_exporter 等待时间为 30s。
2.配置并使用自定义邮箱报警样式模板
描述: 虽然默认的邮件报警样式模板已经包含了所有核心的信息,但是邮件格式内容可以更优雅直观一些,同时AlertManager 也是支持自定义邮件模板配置的。
Step 1.首先新建一个模板文件 email.tmpl
tee email.tmpl<<'EOF'
{{ define "email.from" }}monitor@weiyigeek.com.cn{{ end }}
{{ define "email.to" }}master@weiyigeek.top{{ end }}
{{ define "email.to.html" }}
{{ range .Alerts }}
<b>=========start==========</b><br>
告警程序: prometheus_alert <br>
告警级别: {{ .Labels.severity }} 级 <br>
告警类型: {{ .Labels.alertname }} <br>
故障主机: {{ .Labels.instance }} <br>
告警主题: {{ .Annotations.summary }} <br>
告警详情: {{ .Annotations.description }} <br>
触发时间: {{ .StartsAt.Format "2006-01-02 15:04:05" }} <br>
<b>=========end==========</b><br>
{{ end }}
{{ end }}
EOF
Tips : 注意上述的.StartsAt.Format的格式化字符必须是"2006-01-02 15:04:05",否则报警的时间不对。
Step 2.其次在AlertManager主配置文件中引用模板及其定义
tee alertmanager.yaml <<'EOF'
global:
  resolve_timeout: 5m
  smtp_from: 'monitor@weiyigeek.com.cn'
  smtp_smarthost: 'smtp.exmail.qq.com:465'
  smtp_auth_username: 'monitor@weiyigeek.com.cn'
  smtp_auth_password: 'xxxxxxxxxxxxxxx'
  smtp_require_tls: false
  # smtp_hello: 'qq.com'

# - Tips 上面的全局邮件参数无法从email.tmpl中读取{{ template "email.username" . }}坑(排错一下午)
templates:
- '/alertmanager/email.tmpl'

route:
  group_by: ['alertname']
  group_wait: 30s
  group_interval: 1m
  repeat_interval: 10m
  receiver: 'default-email'

receivers:
- name: 'default-email'
  email_configs:
  - to: '{{ template "email.to" . }}'
    html: '{{ template "email.to.html" . }}'
    # 如果问题已解决将发送信息如设置false则不发送
    send_resolved: true

inhibit_rules:
- source_match:
    severity: 'critical'
  target_match:
    severity: 'warning'
  equal: ['alertname', 'instance']
EOF
Tips : 全局中的邮件参数无法从email.tmpl
中读取定义的模板参数,例如{{ template "email.username" . }}
坑(排错一下午)只有以下对象可以读取:
email_config:
  - to: <tmpl_string>
    from: <tmpl_string>
    html: <tmpl_string>  | text: <tmpl_string>  '{{ template "email.default.html" . }}'
Tips : 官方email_config配置参考地址(https://prometheus.io/docs/alerting/latest/configuration/#email_config)
Step 3.重启alertmanager服务
docker restart prometheus_alertmanager
, 然后同样停止192.168.12.109
的node_exporter服务ssh -p 20211 weiyigeek@weiyigeek-109 "sudo -S systemctl stop node_exporter.service"
然后等待prometheus拉取的时间30s,此时为pending状态,再等待30s此时为Firing状态并发送告警邮件,并且在10分钟外如果还收到该报警信息便会再次进行发送。
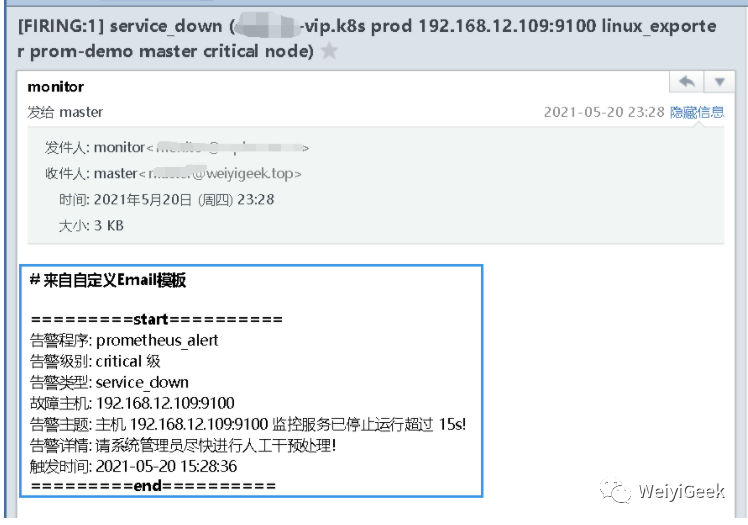
Step 4.至此自定义的Email通知模板的使用到此结束,但是此模板还有不够完善的地方例如当计算机恢复后的通知信息没有进行判断。
3.配置并使用企业微信发送报警通知
描述: Alertmanager 已经内置了对企业微信的支持,我们可以通过企业微信来管理报警,更进一步可以通过企业微信和微信的互通来直接将告警消息转发到个人微信上,在前面的Alertmanager.yaml配置文件参数进行了解也可以从prometheus的官网 中给出了企业微信的相关配置说明如下:
# Whether or not to notify about resolved alerts.
[ send_resolved: <boolean> | default = false ]

# The WeChat API URL.
[ api_url: <string> | default = global.wechat_api_url ]

# 企业微信账号唯一 ID, 可以在我的企业中查看。
[ corp_id: <string> | default = global.wechat_api_corp_id ]
# 第三方企业应用的密钥,可以在自己创建的第三方企业应用详情页面查看。
[ api_secret: <secret> | default = global.wechat_api_secret ]
# 第三方企业应用的 ID,可以在自己创建的第三方企业应用详情页面查看。
[ agent_id: <string> | default = '{{ template "wechat.default.agent_id" . }}' ]
# 在后台通讯录查看需要发送的组的部门ID ( PartyID1 | PartyID2)
[ to_party: <string> | default = '{{ template "wechat.default.to_party" . }}' ]
# 发送的成员 @all 表示所有的成员
[ to_user: <string> | default = '{{ template "wechat.default.to_user" . }}' ]
# 发送给特点 tag 标记的,
[ to_tag: <string> | default = '{{ template "wechat.default.to_tag" . }}' ]
#
[ message: <tmpl_string> | default = '{{ template "wechat.default.message" . }}' ]
Tips
:
企业微信相关概念说明请参考[企业微信API说明](https://work.weixin.qq.com/api/doc#90000/90135/90665),可以在企业微信的后台中建立多个应用,每个应用对应不同的报警分组,由企业微信来做接收成员的划分。
操作流程步骤:
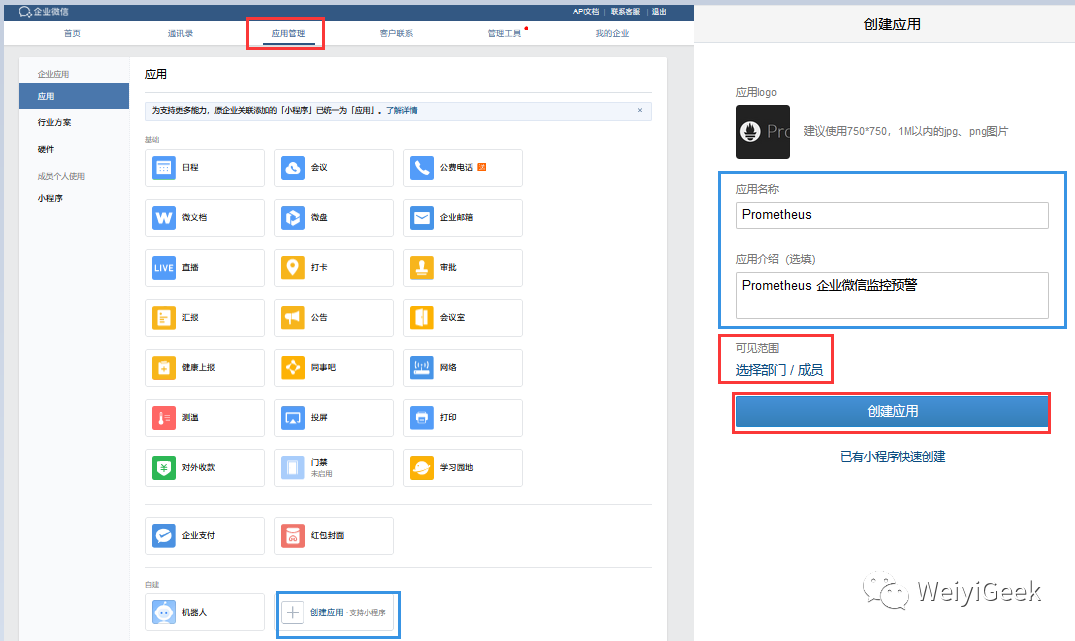
Step 1.访问企业微信网站有账号的直接扫码登陆如果没有就注册一个即可,登陆后访问企业应用进行创建自建应用,点击创建应用按钮->填写应用相关信息(包括应用名称、或应用介绍以及可用范围)。
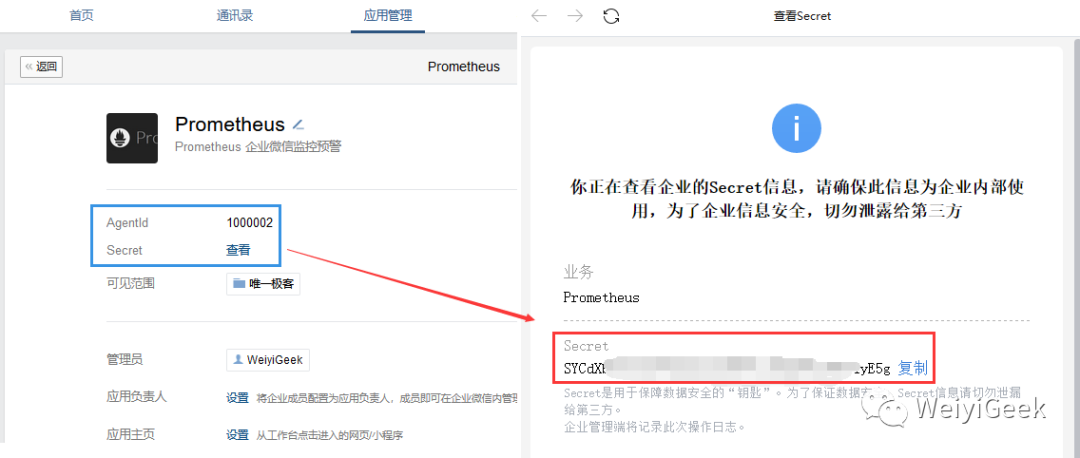
Step 2.查看的获得 AgentId 以及 Secret 将其记录下来以及部门
ID:to_party
(需要发送的组),在后面的AlertManager.yml
配置文件中使用。
# - 例如:博主的AgentId和Secret的格式如下
企业ID: ww32cf0bf4e4b11487
agent_id: 1000002
api_secret: SYCdXbWj5SjdT9pOSQnjIZ4RF_SIRqERVuZNWE1yE5g
to_party: 1
Step 3.编辑Alertmanager.yaml主配置文件设置企业微信通知相关参数。
tee alertmanager.yaml <<'EOF'
global:
  resolve_timeout: 2m

templates:
- '/alertmanager/*.tmpl'

route:
  group_by: ['alertname']
  group_wait: 30s
  group_interval: 1m
  repeat_interval: 10m
  receiver: 'wechat'

receivers:
- name: 'default-email'
  email_configs:
  - from: 'monitor@weiyigeek.com.cn'
    smarthost: 'smtp.exmail.qq.com:465'
    auth_username: 'monitor@weiyigeek.com.cn'
    auth_password: 'xxxxxxxxxxxxxxx'
    require_tls: false
    # smtp_hello: 'qq.com'
    to: '{{ template "email.to" . }}'
    html: '{{ template "email.to.html" . }}'
    send_resolved: true

- name: 'wechat'
  wechat_configs:
  - send_resolved: true
    api_url: 'https://qyapi.weixin.qq.com/cgi-bin/'
    corp_id: 'ww32cf0bf4e4b11487'
    agent_id: '1000002'
    api_secret: 'SYCdXbWj5SjdT9pOSQnjIZ4RF_SIRqERVuZNWE1yE5g'
    to_user: '@all'
    to_party: '1'
    message: '{{ template "wechat.default.message" . }}'

inhibit_rules:
- source_match:
    severity: 'critical'
  target_match:
    severity: 'warning'
  equal: ['alertname', 'instance']
EOF
Step 4.重启Alertmanager服务
docker restart prometheus_alertmanager
以后,我们先来查看默认的企业微信报警信息通知。
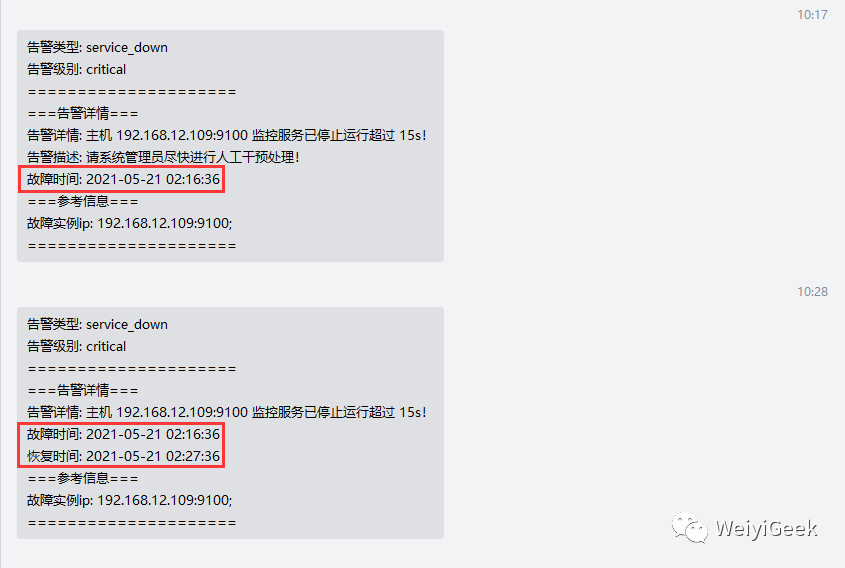
Step 5.采用自定义的Wechat报警模块(包括Firing和Resolved)的信息通知
tee wechat.tmpl <<'EOF'
{{ define "wechat.default.message" }}
{{- if gt (len .Alerts.Firing) 0 -}}
{{- range $index, $alert := .Alerts -}}
{{- if eq $index 0 -}}
告警类型: {{ $alert.Labels.alertname }}
告警级别: {{ $alert.Labels.severity }}
=====================
{{- end }}
===告警详情===
告警详情: {{ $alert.Annotations.summary }}
告警描述: {{ $alert.Annotations.description }}
故障时间: {{ $alert.StartsAt.Format "2006-01-02 15:04:05" }}
===参考信息===
{{ if gt (len $alert.Labels.instance) 0 -}}故障实例ip: {{ $alert.Labels.instance }};{{- end -}}
{{- if gt (len $alert.Labels.namespace) 0 -}}故障实例所在namespace: {{ $alert.Labels.namespace }};{{- end -}}
{{- if gt (len $alert.Labels.node) 0 -}}故障物理机ip: {{ $alert.Labels.node }};{{- end -}}
{{- if gt (len $alert.Labels.pod_name) 0 -}}故障pod名称: {{ $alert.Labels.pod_name }}{{- end }}
=====================
{{- end }}
{{- end }}

{{- if gt (len .Alerts.Resolved) 0 -}}
{{- range $index, $alert := .Alerts -}}
{{- if eq $index 0 -}}
告警类型: {{ $alert.Labels.alertname }}
告警级别: {{ $alert.Labels.severity }}
=====================
{{- end }}
===告警详情===
告警详情: {{ $alert.Annotations.summary }}
故障时间: {{ $alert.StartsAt.Format "2006-01-02 15:04:05" }}
恢复时间: {{ $alert.EndsAt.Format "2006-01-02 15:04:05" }}
===参考信息===
{{ if gt (len $alert.Labels.instance) 0 -}}故障实例ip: {{ $alert.Labels.instance }};{{- end -}}
{{- if gt (len $alert.Labels.namespace) 0 -}}故障实例所在namespace: {{ $alert.Labels.namespace }};{{- end -}}
{{- if gt (len $alert.Labels.node) 0 -}}故障物理机ip: {{ $alert.Labels.node }};{{- end -}}
{{- if gt (len $alert.Labels.pod_name) 0 -}}故障pod名称: {{ $alert.Labels.pod_name }};{{- end }}
=====================
{{- end }}
{{- end }}
{{- end }}
EOF
Step 6.将alertmanager主配置yaml文件上面
message: '{{ template "wechat.default.message" . }}'
采用注释的#去掉即可启用自定义模板信息,将192.168.12.109
机器的node_exporter进行关闭测试模板情况,等待3m将把警告进行发送。
# 重启
docker restart prometheus_alertmanager
# 日志查看
docker logs --tail 50 -f prometheus_alertmanager
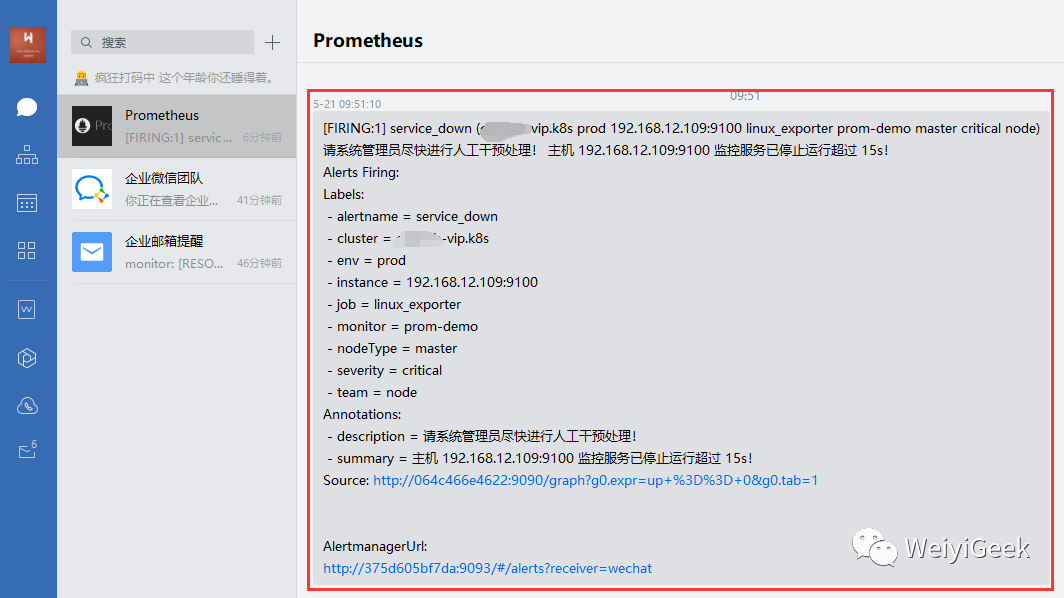
Step 7.异常告警
(Alerts.Firing)
以及异常恢复(Alerts.Resolved)
通知发送结果查看。
补充说明:
1.Wechat 模板示例学习与改进。
{{ define "wechat.default.message" }}
{{- if gt (len .Alerts.Firing) 0 -}}
{{- range $index, $alert := .Alerts -}}
{{- if eq $index 0 }}
==========异常告警==========
告警类型: {{ $alert.Labels.alertname }}
告警级别: {{ $alert.Labels.severity }}
告警详情: {{ $alert.Annotations.message }}{{ $alert.Annotations.description}};{{$alert.Annotations.summary}}
故障时间: {{ ($alert.StartsAt.Add 28800e9).Format "2006-01-02 15:04:05" }}
{{- if gt (len $alert.Labels.instance) 0 }}
实例信息: {{ $alert.Labels.instance }}
{{- end }}
{{- if gt (len $alert.Labels.namespace) 0 }}
命名空间: {{ $alert.Labels.namespace }}
{{- end }}
{{- if gt (len $alert.Labels.node) 0 }}
节点信息: {{ $alert.Labels.node }}
{{- end }}
{{- if gt (len $alert.Labels.pod) 0 }}
实例名称: {{ $alert.Labels.pod }}
{{- end }}
============END============
{{- end }}
{{- end }}
{{- end }}
{{- if gt (len .Alerts.Resolved) 0 -}}
{{- range $index, $alert := .Alerts -}}
{{- if eq $index 0 }}
==========异常恢复==========
告警类型: {{ $alert.Labels.alertname }}
告警级别: {{ $alert.Labels.severity }}
告警详情: {{ $alert.Annotations.message }}{{ $alert.Annotations.description}};{{$alert.Annotations.summary}}
故障时间: {{ ($alert.StartsAt.Add 28800e9).Format "2006-01-02 15:04:05" }}
恢复时间: {{ ($alert.EndsAt.Add 28800e9).Format "2006-01-02 15:04:05" }}
{{- if gt (len $alert.Labels.instance) 0 }}
实例信息: {{ $alert.Labels.instance }}
{{- end }}
{{- if gt (len $alert.Labels.namespace) 0 }}
命名空间: {{ $alert.Labels.namespace }}
{{- end }}
{{- if gt (len $alert.Labels.node) 0 }}
节点信息: {{ $alert.Labels.node }}
{{- end }}
{{- if gt (len $alert.Labels.pod) 0 }}
实例名称: {{ $alert.Labels.pod }}
{{- end }}
============END============
{{- end }}
{{- end }}
{{- end }}
{{- end }}
0x02 实现Prometheus安全认证配置
描述: 由于 export
并没有提供任何认证支持,所需要借助 Nginx 作为反向代理服务器,添加 HTTP Basic Auth
功能,此时只有授权的用户才能采集监控指标, 可以极大避免未授权访问的情况出现。
操作流程
1.我们采用Nginx镜像作为演示搭建与.htpasswd配置生成。
# 镜像拉取与镜像运行
docker pull nginx:1.21.0
docker run --name auth -d nginx:1.21.0
docker exec -it auth bash

# 使用 `apache2-utils` 提供的 `htpasswd` 工具创建一个用户文件,该镜像中没自带所以我们下载即可
apt install apache2-utils
# 运行 htpasswd 生成一个或多个认证用户
htpasswd -bc htpasswd.auth weiyigeek password
Adding password for user weiyigeek
htpasswd -b htpasswd.auth prometheus password
Adding password for user prometheus
htpasswd -b htpasswd.auth monitor password
Adding password for user monitor
2.准备映射到nginx容器中相关文件
# 拷贝容器中nginx配置
docker cp auth:/etc/nginx monitor/nginx

# 拷贝生成htpasswd.auth 到宿主机
docker cp auth:/tmp/htpasswd.auth monitor/nginx

# Nginx 配置文件
root@prometheus:/monitor/nginx/conf# cat conf.d/default.conf
server {
  listen       8080;
  listen  [::]:8080;
  server_name  monitor.weiyigeek.top;

  #access_log  var/log/nginx/host.access.log  main;
  add_header X-Frame-Options SAMEORIGIN;
  auth_basic "weiyigeek Prometheus Metrics";
  auth_basic_user_file etc/nginx/auth/htpasswd.auth;
  #这里放的是认证文件位置

  location  {
    proxy_pass http://monitor.weiyigeek.top:9090;
    proxy_redirect          off;
    proxy_set_header        X-Real-IP       $remote_addr;
    proxy_set_header        X-Forwarded-For $proxy_add_x_forwarded_for;
    proxy_set_header        Host            $host;
    proxy_next_upstream error timeout invalid_header http_500 http_502 http_503 http_504 http_404;
    access_log  var/log/nginx/prometheus_access.log;
  }
}
3.启动nginx反代容器的参数及状态查看
# - 容器启动
docker run -d --name=prometheus_proxy -p 8080:8080 -v monitor/nginx/conf:/etc/nginx -v monitor/nginx/logs:/var/log/nginx/ nginx:1.21.0

# - 容器状态
docker ps
  <!-- CONTAINER ID   IMAGE                   COMMAND                  CREATED         STATUS         PORTS                                               NAMES
  6347a6498e69   nginx:1.21.0            "/docker-entrypoint.…"   6 minutes ago   Up 6 minutes   80/tcp, 0.0.0.0:8080->8080/tcp, :::8080->8080/tcp   prometheus_proxy -->
4.系统防火墙策略设置(安装最小访问权限设置)
# 启动防火墙 & 查看状态
systemctl enable ufw && systemctl restart ufw
ufw status && systemctl status ufw

# 允许所有的机器访问 80(Grafana),8080(Nginx Proxy Prometheus Server)
sudo ufw allow proto tcp to port 80,8080

# 可以通过ip addr查看网卡的网段以便后续docker或者本地访问。
ip addr

# 只允许从本地和docker0网卡访问 9090,9093,9094,9115 端口
sudo ufw allow proto tcp from 127.0.0.1 to any port 9090,9093,9094,9115
ufw delete allow proto tcp from 172.17.0.1/16 to any port 9090,9093,9094,9115
WeiyiGeek Blog - 为了能到远方,脚下的每一步都不能少。
原文地址: https://mp.weixin.qq.com/s/Cuk0lKxjiof26TQA-bzZkw
Tips : 本文章来源 Blog 站点或者 WeiyiGeek
公众账号 (技术交流、友链交换请邮我哟
),
微信公众号-WeiyiGeek # 精华文章发布地址(及时发布)
首页-https://weiyigeek.top # 国内有时访问较慢(及时更新)
博客-https://blog.weiyigeek.top # 国内访问快但(更新不及时)
