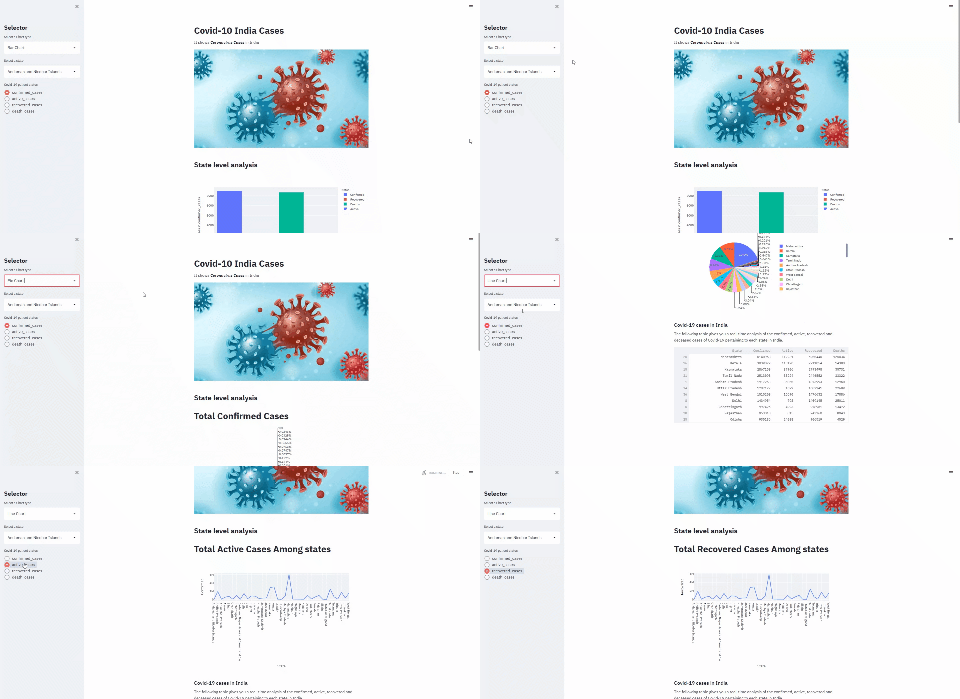
在上回初步介绍了“steamlit”框架的基本用法之后(干货分享 | 用 Streamlit 来制作数据可视化面板教程(一)),这回我们动手来实践一下,用“streamlit”框架来制作一个可视化仪表盘,用到的数据是印度在新冠病毒的影响之下病例数据,包括了印度每个州的“死亡数据”、“治愈数据”、“确诊数据”以及“活跃病例”,感兴趣的童鞋也可以一起动手来实现一下。
import streamlit as stimport pandas as pdimport numpy as npimport plotly.express as pxfrom PIL import Image@st.cache(ttl=60 * 5, max_entries=20)def load_data():data = pd.read_csv("state_wise.csv")return datadf = load_data()
我们用到了“pandas”模块当中的“read_csv”的方法,当然特别要指的注意的是,里面用到了“st.cache()”作为装饰器,由于考虑到可能引用的数据会时时发生变化,因此我们会每隔五分钟对缓存做一次清理,并且最多清理20次,要是引用的源数据不会经常改变,那么你可以设置为是
@st.cache(persist=True)
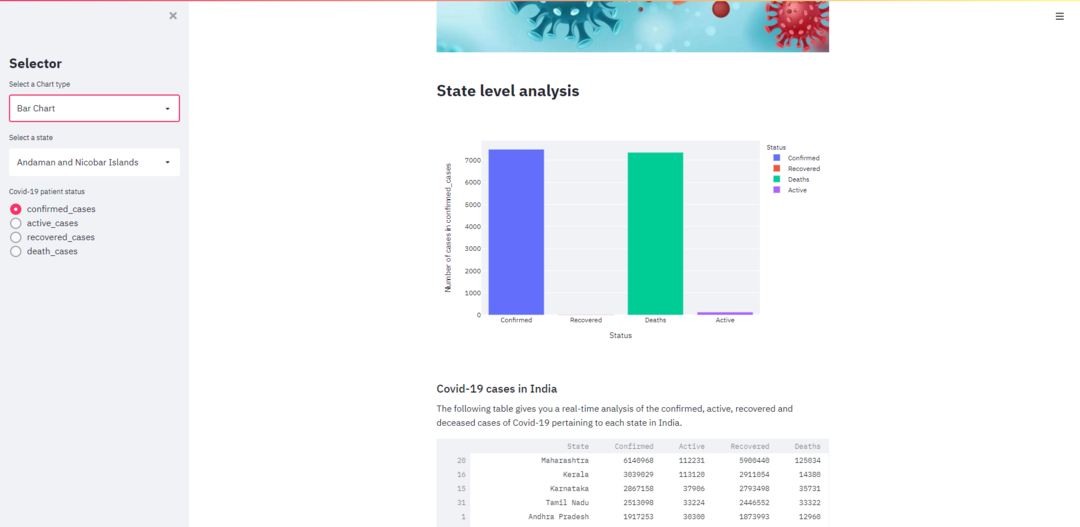
st.title('Covid-10 India Cases')st.write("It shows ***Coronavirus Cases*** in India")st.sidebar.title("Selector")image = Image.open("2.jpg")st.image(image, use_column_width=True)st.markdown('<style>body{background-color:lightblue;}</style>', unsafe_allow_html=True)visualization = st.sidebar.selectbox('Select a Chart type', ("Bar Chart", "Pie Chart", "Line Chart"))state_select = st.sidebar.selectbox('Select a state', df['State'].unique())status_select = st.sidebar.radio("Covid-19 patient status", ('confirmed_cases', 'active_cases','recovered_cases', 'death_cases'))selected_state = df[df['State'] == state_select]st.markdown("## **State level analysis**")
在“streamlit”中的“image”方法来读取图片,而要是我们用到下拉框则是用“st.sidebar.selectbox”方法,而要是使用单选框的话,则是用“st.sidebar.radio”方法,
state_total = get_total_dataframe(df)if visualization == "Bar Chart":state_total_graph = px.bar(state_total, x = 'Status', y = 'Number of cases',labels = {"Number of cases": "Number of cases in %s" % (status_select)}, color="Status")st.plotly_chart(state_total_graph)elif visualization == "Pie Chart":if status_select == "confirmed_cases":st.title("Total Confirmed Cases ")fig = px.pie(df.iloc[1:], values=df['Confirmed'], names = df['State'])st.plotly_chart(fig)
def get_table():datatable = df[['State', 'Confirmed', 'Active', 'Recovered', 'Deaths']].sort_values(by=['Confirmed'], ascending=False)datatable = datatable[datatable['State'] != 'State Unassigned']return datatabledatatable = get_table()st.markdown("### Covid-19 cases in India")st.markdown("The following table gives you a real-time analysis of the confirmed, active, recovered and deceased cases of Covid-19 pertaining to each state in India.")st.dataframe(datatable) # will display the dataframe


文章转载自关于数据分析与可视化,如果涉嫌侵权,请发送邮件至:contact@modb.pro进行举报,并提供相关证据,一经查实,墨天轮将立刻删除相关内容。


