


作者
digoal
日期
2021-05-18
标签
PostgreSQL , 近似 , DataSketches , 概率 , 压缩 , distinct , 分位 , rank , 高频柱状图 , count distinct , quantiles , most-frequent items , joins , matrix computations , graph analysis , 实时 大数据 近似分析 , HLL , CPC , KLL , 频率
背景
https://github.com/apache/datasketches-postgresql
The Business Challenge 商业挑战:
Analyzing Big Data Quickly.
近似算法库项目 - datasketches
https://datasketches.apache.org/
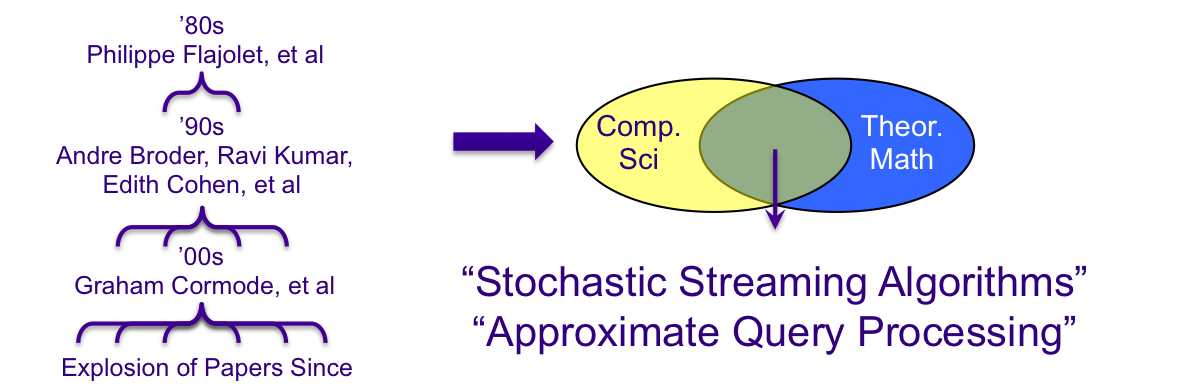
In the analysis of big data there are often problem queries that don’t scale because they require huge compute resources and time to generate exact results. Examples include count distinct, quantiles, most-frequent items, joins, matrix computations, and graph analysis.
If approximate results are acceptable, there is a class of specialized algorithms, called streaming algorithms, or sketches that can produce results orders-of magnitude faster and with mathematically proven error bounds. For interactive queries there may not be other viable alternatives, and in the case of real-time analysis, sketches are the only known solution.
For any system that needs to extract useful information from big data these sketches are a required toolkit that should be tightly integrated into their analysis capabilities. This technology has helped Yahoo (Verizon Media) successfully reduce data processing times from days or hours to minutes or seconds on a number of its internal platforms.
This project is dedicated to providing a broad selection of sketch algorithms of production quality. Contributions are welcome from those interested in further development of this science and art.
Fast
Sketches are fast. The sketch algorithms in this library process data in a single pass and are suitable for both real-time and batch. Sketches enable streaming computation of set expression cardinalities, quantiles, frequency estimation and more. In addition, designing a system around sketching allows simplification of system's architecture and reduction in overall compute resources required for these heretofore difficult computational tasks.
Big Data
This library has been specifically designed for production systems that must process massive data. The library includes adaptors for Apache Hive, Apache Pig, and PostgreSQL (C++). These adaptors also stand as examples for adaptors for other systems. The sketches in this library are designed to have compatible binary representations across languages (Java, C++, Python) and platforms.
Analysis
Built-in Theta Sketch set operators (Union, Intersection, Difference) produce sketches as a result (and not just a number) enabling full set expressions of cardinality, such as ((A ∪ B) ∩ (C ∪ D)) \ (E ∪ F). This capability along with predictable and superior accuracy (compared with Include/Exclude approaches) enable unprecedented analysis capabilities for fast queries.
近似算法库与数据库的整合
http://db.cs.berkeley.edu/cs286/papers/flajoletmartin-jcss1985.pdf
http://db.cs.berkeley.edu/cs286/papers/synopses-fntdb2012.pdf
https://people.cs.umass.edu/~mcgregor/711S12/sketches1.pdf
- Probabilistic counting Algorithms for Data Base Applications
- Synopses for Massive Data: Samples, Histograms, Wavelets, Sketches
- Sketch Techniques for Approximate Query Processing
PG的近似算法库插件
PostgreSQL Adaptor for C++ DataSketches
Please visit the main DataSketches website for more information.
If you are interested in making contributions to this site please see our Community page for how to contact us.
This module currently supports the following sketches(目前已整合的近似算法库):
- CPC (Compressed Probabilistic Counting) sketch - very compact (smaller than HLL when serialized) distinct-counting sketch
- Theta sketch - distinct counting with set operations (intersection, a-not-b)
- HLL sketch - very compact distinct-counting sketch based on HyperLogLog algorithm
- KLL float quantiles sketch - for estimating distributions: quantile, rank, PMF (histogram), CDF
- Frequent strings sketch - capture the heaviest items (strings) by count or by some other weight
Examples
Distinct counting with CPC sketch
Suppose 100 million random integer values uniformly distributed in the range from 1 to 100M have been generated and inserted into a table
Exact count distinct:
$ time psql test -c "select count(distinct id) from random_ints_100m"
  count
----------
 63208457
(1 row)

real    1m59.060s
Approximate count distinct:
$ time psql test -c "select cpc_sketch_distinct(id) from random_ints_100m"
 cpc_sketch_distinct
---------------------
    63423695.9451363
(1 row)

real    0m20.680s
Note that the above one-off distinct count is just to show the basic usage. Most importantly, the sketch can be used as an "additive" distinct count metric in a data cube.
Aggregate union:
create table cpc_sketch_test(sketch cpc_sketch);
insert into cpc_sketch_test select cpc_sketch_build(1);
insert into cpc_sketch_test select cpc_sketch_build(2);
insert into cpc_sketch_test select cpc_sketch_build(3);
select cpc_sketch_get_estimate(cpc_sketch_union(sketch)) from cpc_sketch_test;
 cpc_sketch_get_estimate
-------------------------
        3.00024414612919
Non-aggregate union:
select cpc_sketch_get_estimate(cpc_sketch_union(cpc_sketch_build(1), cpc_sketch_build(2)));
 cpc_sketch_get_estimate
-------------------------
        2.00016277723359
Distinct counting with Theta sketch
See above for the exact distinct count of 100 million random integers
Approximate distinct count:
$ time psql test -c "select theta_sketch_distinct(id) from random_ints_100m"
 theta_sketch_distinct
-----------------------
      64593262.4373193
(1 row)

real    0m19.701s
Note that the above one-off distinct count is just to show the basic usage. Most importantly, the sketch can be used as an "additive" distinct count metric in a data cube.
Aggregate union:
create table theta_sketch_test(sketch theta_sketch);
insert into theta_sketch_test select theta_sketch_build(1);
insert into theta_sketch_test select theta_sketch_build(2);
insert into theta_sketch_test select theta_sketch_build(3);
select theta_sketch_get_estimate(theta_sketch_union(sketch)) from theta_sketch_test;
 theta_sketch_get_estimate
---------------------------
                         3
Non-aggregate set operations:
create table theta_set_op_test(sketch1 theta_sketch, sketch2 theta_sketch);
insert into theta_set_op_test select theta_sketch_build(1), theta_sketch_build(1);
insert into theta_set_op_test select theta_sketch_build(1), theta_sketch_build(2);

select theta_sketch_get_estimate(theta_sketch_union(sketch1, sketch2)) from theta_set_op_test;
 theta_sketch_get_estimate
---------------------------
                         1
                         2
(2 rows)

select theta_sketch_get_estimate(theta_sketch_intersection(sketch1, sketch2)) from theta_set_op_test;
 theta_sketch_get_estimate
---------------------------
                         1
                         0
(2 rows)

select theta_sketch_get_estimate(theta_sketch_a_not_b(sketch1, sketch2)) from theta_set_op_test;
 theta_sketch_get_estimate
---------------------------
                         0
                         1
(2 rows)
Distinct counting with HLL sketch
See above for the exact distinct count of 100 million random integers
Approximate distinct count:
$ time psql test -c "select hll_sketch_distinct(id) from random_ints_100m"
 hll_sketch_distinct
---------------------
    63826337.5738399
(1 row)

real    0m19.075s
Note that the above one-off distinct count is just to show the basic usage. Most importantly, the sketch can be used as an "additive" distinct count metric in a data cube.
Aggregate union:
create table hll_sketch_test(sketch hll_sketch);
insert into hll_sketch_test select hll_sketch_build(1);
insert into hll_sketch_test select hll_sketch_build(2);
insert into hll_sketch_test select hll_sketch_build(3);
select hll_sketch_get_estimate(hll_sketch_union(sketch)) from hll_sketch_test;
     hll_sketch_get_estimate
-------------------------
        3.00000001490116
Non-aggregate union:
select hll_sketch_get_estimate(hll_sketch_union(hll_sketch_build(1), hll_sketch_build(2)));
 hll_sketch_get_estimate
-------------------------
        2.00000000496705
Estimating quanitles, ranks and histograms with KLL sketch
Table "normal" has 1 million values from the normal (Gaussian) distribution with mean=0 and stddev=1.
We can build a sketch, which represents the distribution:
create table kll_float_sketch_test(sketch kll_float_sketch);
$ psql test -c "insert into kll_float_sketch_test select kll_float_sketch_build(value) from normal"
INSERT 0 1
We expect the value with rank 0.5 (median) to be approximately 0:
$ psql test -c "select kll_float_sketch_get_quantile(sketch, 0.5) from kll_float_sketch_test"
 kll_float_sketch_get_quantile
-------------------------------
                    0.00648344
In reverse: we expect the rank of value 0 (true median) to be approximately 0.5:
$ psql test -c "select kll_float_sketch_get_rank(sketch, 0) from kll_float_sketch_test"
 kll_float_sketch_get_rank
---------------------------
                  0.496289
Getting several quantiles at once:
$ psql test -c "select kll_float_sketch_get_quantiles(sketch, ARRAY[0, 0.25, 0.5, 0.75, 1]) from kll_float_sketch_test"
          kll_float_sketch_get_quantiles
--------------------------------------------------
 {-4.72317,-0.658811,0.00648344,0.690616,4.91773}
Getting the probability mass function (PMF):
$ psql test -c "select kll_float_sketch_get_pmf(sketch, ARRAY[-2, -1, 0, 1, 2]) from kll_float_sketch_test"
               kll_float_sketch_get_pmf
------------------------------------------------------
 {0.022966,0.135023,0.3383,0.343186,0.13466,0.025865}
The ARRAY[-2, -1, 0, 1, 2] of 5 split points defines 6 intervals (bins): (-inf,-2), [-2,-1), [-1,0), [0,1), [1,2), [2,inf). The result is 6 estimates of probability mass in these bins (fractions of input values that fall into the bins). These fractions can be transformed to counts (histogram) by scaling them by the factor of N (the total number of input values), which can be obtained from the sketch:
$ psql test -c "select kll_float_sketch_get_n(sketch) from kll_float_sketch_test"
 kll_float_sketch_get_n
------------------------
                1000000
In this simple example we know the value of N since we constructed this sketch, but in a general case sketches are merged across dimensions of data hypercube, so the vale of N is not known in advance.
Note that the normal distribution was used just to show the basic usage. The sketch does not make any assumptions about the distribution.
Let's create two more sketches to show merging kll_float_sketch:
insert into kll_float_sketch_test select kll_float_sketch_build(value) from normal;
insert into kll_float_sketch_test select kll_float_sketch_build(value) from normal;
select kll_float_sketch_get_quantile(kll_float_sketch_merge(sketch), 0.5) from kll_float_sketch_test;
 kll_float_sketch_get_quantile
-------------------------------
                    0.00332207
Frequent strings
Consider a numeric Zipfian distribution with parameter alpha=1.1 (high skew)
and range of 213, so that the number 1 has the highest frequency,
the number 2 appears substantially less frequently and so on.
Suppose zipf_1p1_8k_100m table has 100 million random values drawn from such
a distribution, and the values are converted to strings.
Suppose the goal is to get the most frequent strings from this table. In
terms of the frequent items sketch we have to chose a threshold. Let's try
to capture values that repeat more than 1 million times, or more than 1% of
the 100 million entries in the table. According to the error table,
frequent items sketch of size 29 must capture all values more
frequent then about 0.7% of the input.
The following query is to build a sketch with lg_k=9 and get results with
estimated weight above 1 million using "no false negatives" policy.
The output format is: value, estimate, lower bound, upper bound.
$ time psql test -c "select frequent_strings_sketch_result_no_false_negatives(frequent_strings_sketch_build(9, value), 1000000) from zipf_1p1_8k_100m"
 frequent_strings_sketch_result_no_false_negatives
---------------------------------------------------
 (1,15328953,15209002,15328953)
 (2,7156065,7036114,7156065)
 (3,4578361,4458410,4578361)
 (4,3334808,3214857,3334808)
 (5,2608563,2488612,2608563)
 (6,2135715,2015764,2135715)
 (7,1801961,1682010,1801961)
 (8,1557433,1437482,1557433)
 (9,1368446,1248495,1368446)
 (10,1216532,1096581,1216532)
 (11,1098304,978353,1098304)
(11 rows)

real    0m38.178s
Here is an equivalent exact computation:
$ time psql test -c "select value, weight from (select value, count(*) as weight from zipf_1p1_8k_100m group by value) t where weight > 1000000 order by weight desc"
 value |  weight
-------+----------
 1     | 15328953
 2     |  7156065
 3     |  4578361
 4     |  3334808
 5     |  2608563
 6     |  2135715
 7     |  1801961
 8     |  1557433
 9     |  1368446
 10    |  1216532
 11    |  1098304
(11 rows)

real    0m18.362s
In this particular case the exact computation happens to be faster. This is
just to show the basic usage. Most importantly, the sketch can be used as an "additive" metric in a data cube, and can be easily merged across dimensions.
Merging frequent_strings_sketch:
create table frequent_strings_sketch_test(sketch frequent_strings_sketch);
insert into frequent_strings_sketch_test select frequent_strings_sketch_build(9, value) from zipf_1p1_8k_100m;
insert into frequent_strings_sketch_test select frequent_strings_sketch_build(9, value) from zipf_1p1_8k_100m;
insert into frequent_strings_sketch_test select frequent_strings_sketch_build(9, value) from zipf_1p1_8k_100m;
select frequent_strings_sketch_result_no_false_negatives(frequent_strings_sketch_merge(9, sketch), 3000000) from frequent_strings_sketch_test;
 frequent_strings_sketch_result_no_false_negatives
---------------------------------------------------
 (1,45986859,45627006,45986859)
 (2,21468195,21108342,21468195)
 (3,13735083,13375230,13735083)
 (4,10004424,9644571,10004424)
 (5,7825689,7465836,7825689)
 (6,6407145,6047292,6407145)
 (7,5405883,5046030,5405883)
 (8,4672299,4312446,4672299)
 (9,4105338,3745485,4105338)
 (10,3649596,3289743,3649596)
 (11,3294912,2935059,3294912)
(11 rows)
使用pgbench可以生成高斯分布, 指数分布数据.
《PostgreSQL 11 preview - pgbench 压测软件增强, 支持random_zipfian数据生成算法》
《生成泊松、高斯、指数、随机分布数据 - PostgreSQL 9.5 new feature - pgbench improve, gaussian (standard normal) & exponential distribution》
PostgreSQL 许愿链接
您的愿望将传达给PG kernel hacker、数据库厂商等, 帮助提高数据库产品质量和功能, 说不定下一个PG版本就有您提出的功能点. 针对非常好的提议,奖励限量版PG文化衫、纪念品、贴纸、PG热门书籍等,奖品丰富,快来许愿。开不开森.
9.9元购买3个月阿里云RDS PostgreSQL实例
PostgreSQL 解决方案集合
德哥 / digoal's github - 公益是一辈子的事.

