


TAG 13
作者
digoal
日期
2017-03-13
标签
PostgreSQL , 10.0 , CLOG , group commit
背景
clog是PostgreSQL的事务提交状态日志,每个事务对应2个BIT,当事务频繁(小事务)结束时,可能出现CLOGControlLock 冲突的问题。
虽然增加clog buffer可以缓解,PostgreSQL 10.0 采样clog group commit进一步降低这个冲突。
提升高并发下的TPS能力。
```
I think the main focus for test in this area would be at higher client
count. At what scale factors have you taken the data and what are
the other non-default settings you have used. By the way, have you
tried by dropping and recreating the database and restarting the server
after each run, can you share the exact steps you have used to perform
the tests. I am not sure why it is not showing the benefit in your testing,
may be the benefit is on some what more higher end m/c or it could be
that some of the settings used for test are not same as mine or the way
to test the read-write workload of pgbench is different.
In anycase, I went ahead and tried further reducing the CLogControlLock
contention by grouping the transaction status updates. The basic idea
is same as is used to reduce the ProcArrayLock contention [1] which is to
allow one of the proc to become leader and update the transaction status for
other active transactions in system. This has helped to reduce the
contention
around CLOGControlLock. Attached patch group_update_clog_v1.patch
implements this idea.
I have taken performance data with this patch to see the impact at
various scale-factors. All the data is for cases when data fits in shared
buffers and is taken against commit - 5c90a2ff on server with below
configuration and non-default postgresql.conf settings.
Performance Data
RAM - 500GB
8 sockets, 64 cores(Hyperthreaded128 threads total)
Non-default parameters
max_connections = 300
shared_buffers=8GB
min_wal_size=10GB
max_wal_size=15GB
checkpoint_timeout =35min
maintenance_work_mem = 1GB
checkpoint_completion_target = 0.9
wal_buffers = 256MB
Refer attached files for performance data.
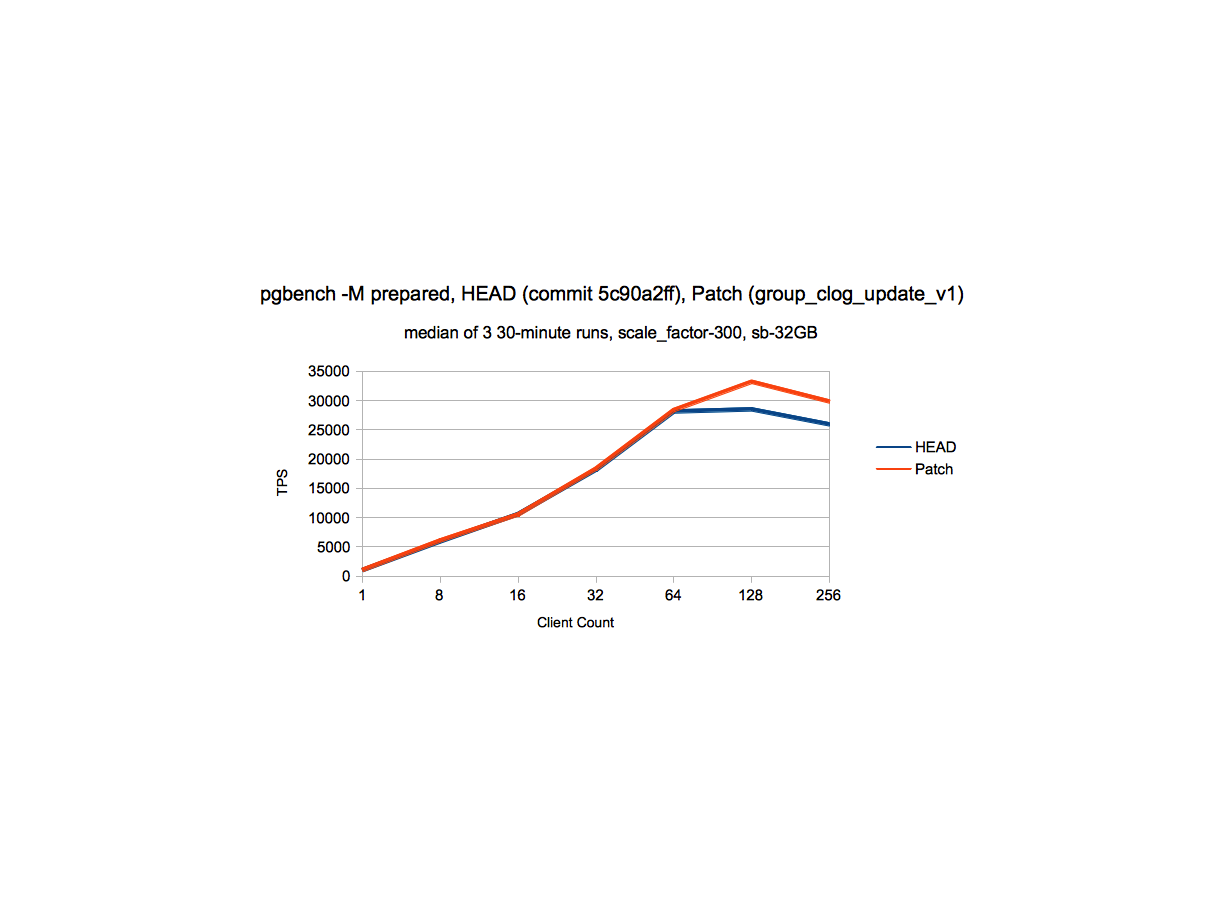
sc_300_perf.png - This data indicates that at scale_factor 300, there is a
gain of ~15% at higher client counts, without degradation at lower client
count.
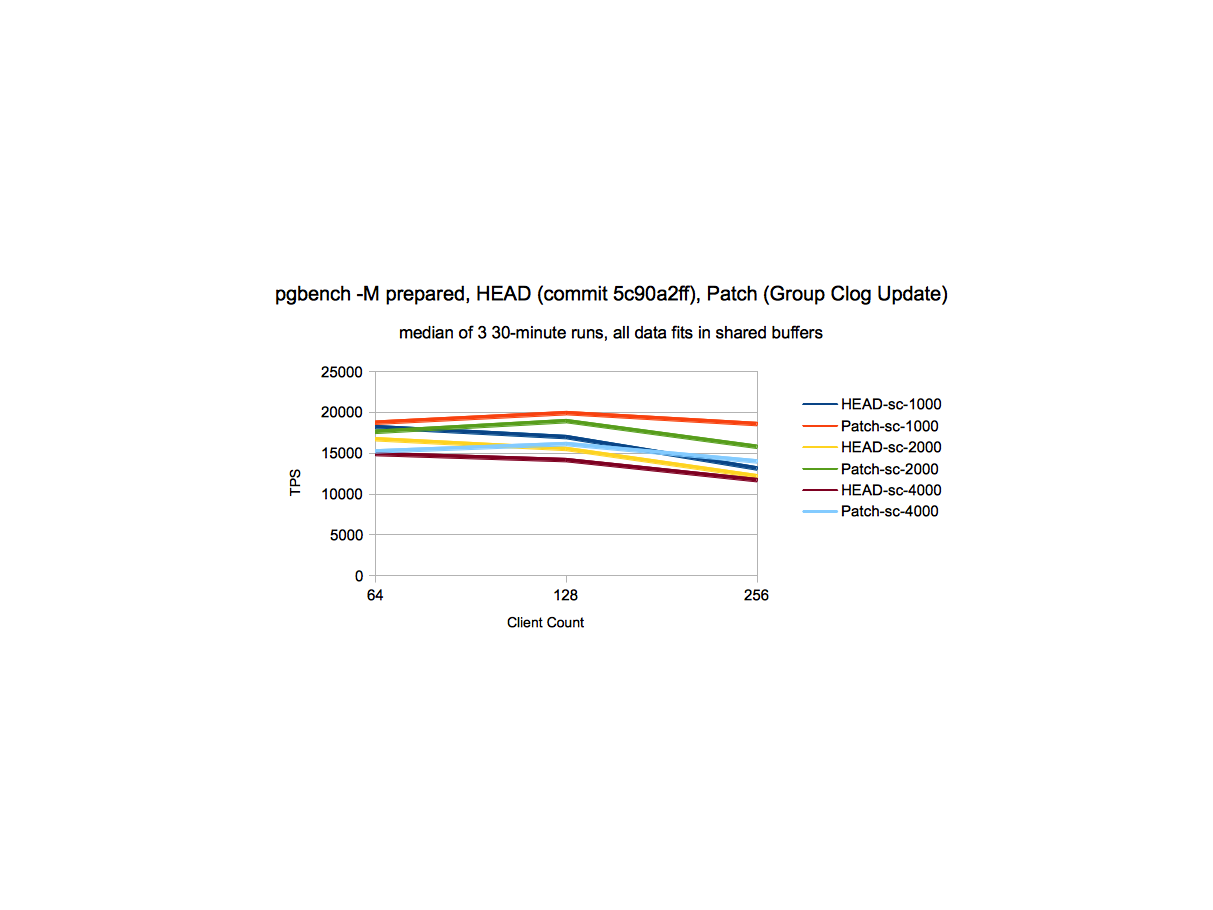
different_sc_perf.png - At various scale factors, there is a gain from
~15% to 41% at higher client counts and in some cases we see gain
of ~5% at somewhat moderate client count (64) as well.
perf_write_clogcontrollock_data_v1.ods - Detailed performance data at
various client counts and scale factors.
Feel free to ask for more details if the data in attached files is not
clear.
Below is the LWLock_Stats information with and without patch:
Stats Data
A. scale_factor = 300; shared_buffers=32GB; client_connections - 128
HEAD - 5c90a2ff
CLogControlLock Data
PID 94100 lwlock main 11: shacq 678672 exacq 326477 blk 204427 spindelay
8532 dequeue self 93192
PID 94129 lwlock main 11: shacq 757047 exacq 363176 blk 207840 spindelay
8866 dequeue self 96601
PID 94115 lwlock main 11: shacq 721632 exacq 345967 blk 207665 spindelay
8595 dequeue self 96185
PID 94011 lwlock main 11: shacq 501900 exacq 241346 blk 173295 spindelay
7882 dequeue self 78134
PID 94087 lwlock main 11: shacq 653701 exacq 314311 blk 201733 spindelay
8419 dequeue self 92190
After Patch group_update_clog_v1
CLogControlLock Data
PID 100205 lwlock main 11: shacq 836897 exacq 176007 blk 116328 spindelay
1206 dequeue self 54485
PID 100034 lwlock main 11: shacq 437610 exacq 91419 blk 77523 spindelay 994
dequeue self 35419
PID 100175 lwlock main 11: shacq 748948 exacq 158970 blk 114027 spindelay
1277 dequeue self 53486
PID 100162 lwlock main 11: shacq 717262 exacq 152807 blk 115268 spindelay
1227 dequeue self 51643
PID 100214 lwlock main 11: shacq 856044 exacq 180422 blk 113695 spindelay
1202 dequeue self 54435
The above data indicates that contention due to CLogControlLock is
reduced by around 50% with this patch.
The reasons for remaining contention could be:
-
Readers of clog data (checking transaction status data) can take
Exclusive CLOGControlLock when reading the page from disk, this can
contend with other Readers (shared lockers of CLogControlLock) and with
exclusive locker which updates transaction status. One of the ways to
mitigate this contention is to increase the number of CLOG buffers for which
patch has been already posted on this thread. -
Readers of clog data (checking transaction status data) takes shared
CLOGControlLock which can contend with exclusive locker (Group leader) which
updates transaction status. I have tried to reduce the amount of work done
by group leader, by allowing group leader to just read the Clog page once
for all the transactions in the group which updated the same CLOG page
(idea similar to what we currently we use for updating the status of
transactions
having sub-transaction tree), but that hasn't given any further performance
boost,
so I left it.
I think we can use some other ways as well to reduce the contention around
CLOGControlLock by doing somewhat major surgery around SLRU like using
buffer pools similar to shared buffers, but this idea gives us moderate
improvement without much impact on exiting mechanism.
Thoughts?
[1] -
http://www.postgresql.org/message-id/CAA4eK1JbX4FzPHigNt0JSaz30a85BPJV+ewhk+wg_o-T6xufEA@mail.gmail.com
With Regards,
Amit Kapila.
EnterpriseDB: http://www.enterprisedb.com
```
这个patch的讨论,详见邮件组,本文末尾URL。
PostgreSQL社区的作风非常严谨,一个patch可能在邮件组中讨论几个月甚至几年,根据大家的意见反复的修正,patch合并到master已经非常成熟,所以PostgreSQL的稳定性也是远近闻名的。
参考
https://www.postgresql.org/message-id/flat/CAA4eK1+8=X9mSNeVeHg_NqMsOR-XKsjuqrYzQf=iCsdh3U4EOA@mail.gmail.com#CAA4eK1+8=X9mSNeVeHg_NqMsOR-XKsjuqrYzQf=iCsdh3U4EOA@mail.gmail.com
https://commitfest.postgresql.org/13/358/
PostgreSQL 许愿链接
您的愿望将传达给PG kernel hacker、数据库厂商等, 帮助提高数据库产品质量和功能, 说不定下一个PG版本就有您提出的功能点. 针对非常好的提议,奖励限量版PG文化衫、纪念品、贴纸、PG热门书籍等,奖品丰富,快来许愿。开不开森.
9.9元购买3个月阿里云RDS PostgreSQL实例
PostgreSQL 解决方案集合
德哥 / digoal's github - 公益是一辈子的事.


