


TAG 18
作者
digoal
日期
2017-05-18
标签
PostgreSQL , 物联网 , 传感器 , lambda , 调度 , 实时 , 流式更新 , UPSERT , insert on conflict do update
背景
越来越多的数据要求实时的分析、聚合、展示最新值、展示异常值、实时的搜索。
例如 金融数据、物联网传感器的数据、网络游戏的在线数据等等。

关于实时搜索,可以参考这篇最佳实践:
关于海量数据的"写入、共享、存储、计算",以及离线分析,则可以参考这篇最佳实践:
关于实时分析、实时更新、实时聚合、实时展示最新值、异常值,是本文的主要内容。
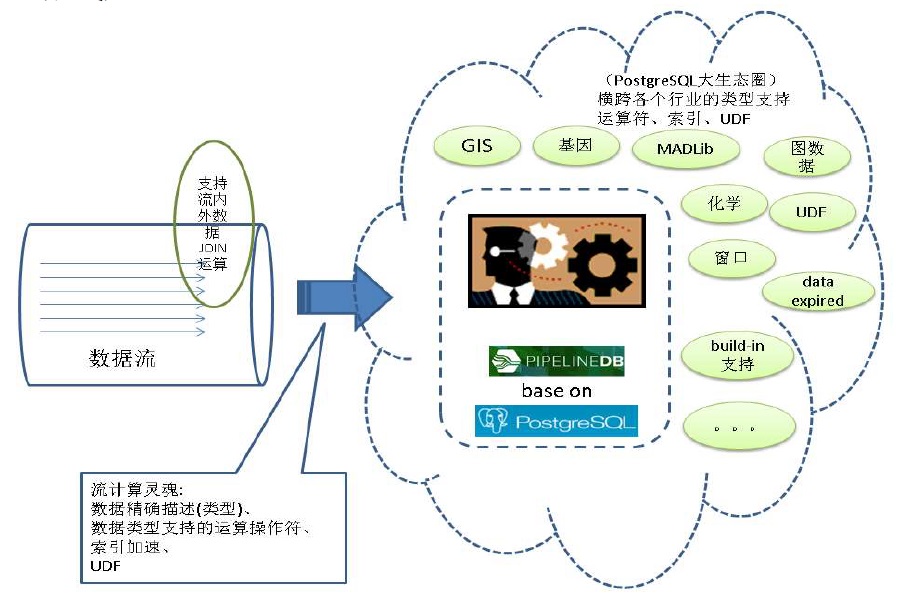
提起实时分析,不得不说流式计算,用户可以参考本文:
《流计算风云再起 - PostgreSQL携PipelineDB力挺IoT》
pipelinedb是一个SQL接口的流计算数据库,正在进行插件化的改造,未来可以作为PostgreSQL数据库的插件使用。
本文将以传感器数据的实时写入、实时更新最新值、实时统计为例,分析三种不同的方案(流式、lambda式、同步实时)的优缺点。
场景设计
有一百万个传感器,每个传感器定期上报数据,用户需求:
1. 实时的查看传感器的最新值,
2. 实时按时间段查看传感器历史数据的统计值。
3. 实时查看传感器的历史明细数据。
4. 实时按其他维度查看传感器历史数据的统计值。
由于数据量可能非常庞大(100TB级),为了实现这4个需求,要求统计数据需要实时或准实时的被计算出来。
表结构设计
明细数据
create table sensor_data(
  pk serial8 primary key, -- 主键
  ts timestamp,  -- 时间戳
  sid int,  -- 传感器ID
  val numeric(10,2)  -- 数据
);
实时聚合设计
1. 每个传感器最后的value
create table sensor_lastdata(
  sid int primary key,  -- 传感器ID,主键
  last_ts timestamp,  -- 时间戳
  last_val numeric(10,2)  -- 值
);
2. 每个传感器每个时段(例如小时)的所有值,总和,记录数,最大值,最小值,平均值,方差。
create table sensor_aggdata(
  sid int,  -- 传感器ID
  ts_group varchar(10),  -- 时间维度分组,例如小时(yyyymmddhh24)
  sum_val numeric,  -- 和
  min_val numeric(10,2),  -- 最小值
  max_val numeric(10,2),  -- 最大值
  avg_val numeric(10,2),  -- 平均值
  count_val int,  -- 计数
  all_vals numeric(10,2)[],  -- 明细值
  unique (sid,ts_group)  -- 唯一约束
);
3. 按地域或其他维度,实时统计传感器上报的数据
略
如何从明细数据取传感器的最新值
取出每个传感器ID的最新值。使用SQL来取,有两种方法,一种是聚合,另一种是窗口函数。
插入一批测试数据
postgres=# insert into sensor_data(ts,sid,val) select clock_timestamp(), random()*100, random()*10000 from generate_series(1,100000);
方法1,聚合。
按SID分组,将VAL聚合为数组(按PK逆序排序),取数组的第一个VALUE。
参考用法:https://www.postgresql.org/docs/9.6/static/functions-aggregate.html
postgres=#  select sid, (array_agg(ts order by pk desc))[1] as last_ts, (array_agg(val order by pk desc))[1] as last_val from sensor_data group by sid;
 sid |          last_ts           | last_val
-----+----------------------------+----------
   0 | 2017-05-18 14:09:10.625812 |  6480.54
   1 | 2017-05-18 14:09:10.627607 |  9644.29
   2 | 2017-05-18 14:09:10.627951 |  3995.04
   3 | 2017-05-18 14:09:10.627466 |   840.80
   4 | 2017-05-18 14:09:10.627703 |  1500.59
   5 | 2017-05-18 14:09:10.627813 |  3109.42
   6 | 2017-05-18 14:09:10.62754  |  4131.31
   7 | 2017-05-18 14:09:10.627851 |  9333.88
......
方法2,窗口。
postgres=# select sid,ts,val from (select sid,ts,val,row_number() over(partition by sid order by pk desc) as rn from sensor_data) t where rn=1;
 sid |             ts             |   val
-----+----------------------------+---------
   0 | 2017-05-18 14:09:10.625812 | 6480.54
   1 | 2017-05-18 14:09:10.627607 | 9644.29
   2 | 2017-05-18 14:09:10.627951 | 3995.04
   3 | 2017-05-18 14:09:10.627466 |  840.80
   4 | 2017-05-18 14:09:10.627703 | 1500.59
   5 | 2017-05-18 14:09:10.627813 | 3109.42
   6 | 2017-05-18 14:09:10.62754  | 4131.31
   7 | 2017-05-18 14:09:10.627851 | 9333.88
......
这两种方法哪种好一点呢?请看执行计划
```
postgres=# set work_mem ='16MB';
SET
postgres=# explain (analyze,verbose,timing,costs,buffers) select sid, (array_agg(ts order by pk desc))[1] as last_ts, (array_agg(val order by pk desc))[1] as last_val from sensor_data group by sid;
QUERY PLAN
GroupAggregate (cost=7117.15..7823.57 rows=101 width=44) (actual time=29.628..88.095 rows=101 loops=1)
Output: sid, (array_agg(ts ORDER BY pk DESC))[1], (array_agg(val ORDER BY pk DESC))[1]
Group Key: sensor_data.sid
Buffers: shared hit=736
-> Sort (cost=7117.15..7293.38 rows=70490 width=26) (actual time=29.273..36.249 rows=70490 loops=1)
Output: sid, ts, pk, val
Sort Key: sensor_data.sid
Sort Method: quicksort Memory: 8580kB
Buffers: shared hit=736
-> Seq Scan on public.sensor_data (cost=0.00..1440.90 rows=70490 width=26) (actual time=0.243..9.768 rows=70490 loops=1)
Output: sid, ts, pk, val
Buffers: shared hit=736
Planning time: 0.077 ms
Execution time: 88.489 ms
(14 rows)
postgres=# explain (analyze,verbose,timing,costs,buffers) select sid,ts,val from (select sid,ts,val,row_number() over(partition by sid order by pk desc) as rn from sensor_data) t where rn=1;
QUERY PLAN
Subquery Scan on t (cost=7117.15..9408.08 rows=352 width=18) (actual time=46.074..81.377 rows=101 loops=1)
Output: t.sid, t.ts, t.val
Filter: (t.rn = 1)
Rows Removed by Filter: 70389
Buffers: shared hit=736
-> WindowAgg (cost=7117.15..8526.95 rows=70490 width=34) (actual time=46.072..76.115 rows=70490 loops=1)
Output: sensor_data.sid, sensor_data.ts, sensor_data.val, row_number() OVER (?), sensor_data.pk
Buffers: shared hit=736
-> Sort (cost=7117.15..7293.38 rows=70490 width=26) (actual time=46.065..51.742 rows=70490 loops=1)
Output: sensor_data.sid, sensor_data.pk, sensor_data.ts, sensor_data.val
Sort Key: sensor_data.sid, sensor_data.pk DESC
Sort Method: quicksort Memory: 8580kB
Buffers: shared hit=736
-> Seq Scan on public.sensor_data (cost=0.00..1440.90 rows=70490 width=26) (actual time=0.245..9.863 rows=70490 loops=1)
Output: sensor_data.sid, sensor_data.pk, sensor_data.ts, sensor_data.val
Buffers: shared hit=736
Planning time: 0.100 ms
Execution time: 82.480 ms
(18 rows)
```
实时更新、统计 - 设计与压测
1. lambda
lambda方式,传感器数据写入明细表,以任务调度的方式,从明细表取出数据并删除,将取出的数据进行增量统计,合并到统计结果中。
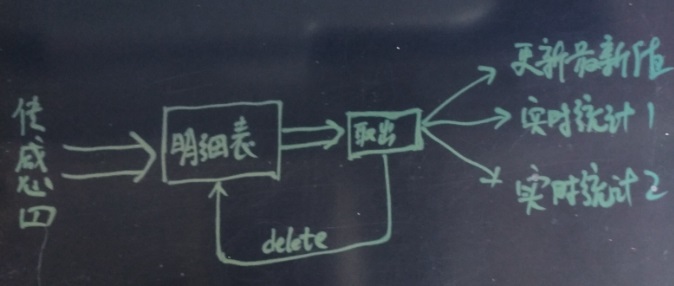
统计维度可能较多,为了并行,剥离数据获取和删除部分的功能。
批量获取并删除明细数据,按pk排序,批量获取若干条。
函数如下:
create or replace function get_sensor_data(i_limit int) returns sensor_data[] as $$
declare
  arr_pk int8[];
  arr_sensor_data sensor_data[];
begin
  select array_agg(t.sensor_data), array_agg((t.sensor_data).pk)
    into arr_sensor_data, arr_pk
    from (select sensor_data from sensor_data order by pk limit i_limit for update skip locked) t ;
  delete from sensor_data WHERE pk = any (arr_pk);
  return arr_sensor_data;
end;
$$ language plpgsql strict;
明细数据获取到之后,继续下一步的动作。
存在则更新,不存在则插入,采用PostgreSQL的insert on conflict语法。
1. 实时更新传感器的最新值
insert into sensor_lastdata
  select sid, (array_agg(ts order by pk desc))[1] as last_ts, (array_agg(val order by pk desc))[1] as last_val from
    unnest(get_sensor_data(1000))
  group by sid
on conflict (sid) do update set last_ts=excluded.last_ts,last_val=excluded.last_val;
2. 批量增量统计传感器的值
统计值的合并方法请关注SQL内容,明细数据按SID聚合为数组按PK顺序存放。
insert into sensor_aggdata (sid,ts_group,sum_val,min_val,max_val,avg_val,count_val,all_vals)
select sid,to_char(ts,'yyyymmddhh24'),sum(val),min(val),max(val),avg(val),count(val),array_agg(val order by pk) from unnest(get_sensor_data(1000))
  group by sid,to_char(ts,'yyyymmddhh24')
  on conflict (sid,ts_group) do update set
    sum_val=sensor_aggdata.sum_val+excluded.sum_val,
    min_val=least(sensor_aggdata.min_val, excluded.min_val),
    max_val=greatest(sensor_aggdata.max_val, excluded.max_val),
    avg_val=(sensor_aggdata.sum_val+excluded.sum_val)/(sensor_aggdata.count_val+excluded.count_val),
    count_val=sensor_aggdata.count_val+excluded.count_val,
    all_vals=array_cat(sensor_aggdata.all_vals, excluded.all_vals);
压测
```
create table sensor_data(
pk serial8 primary key, -- 主键
ts timestamp, -- 时间戳
sid int, -- 传感器ID
val numeric(10,2) -- 数据
);
create table sensor_lastdata(
sid int primary key, -- 传感器ID,主键
last_ts timestamp, -- 时间戳
last_val numeric(10,2) -- 值
);
create table sensor_aggdata(
sid int, -- 传感器ID
ts_group varchar(10), -- 时间维度分组,例如小时(yyyymmddhh24)
sum_val numeric, -- 和
min_val numeric(10,2), -- 最小值
max_val numeric(10,2), -- 最大值
avg_val numeric(10,2), -- 平均值
count_val int, -- 计数
all_vals numeric(10,2)[], -- 明细值
unique (sid,ts_group) -- 唯一约束
);
```
压测1,实时写入,并实时更新传感器的最新值
vi ins.sql
\set sid random(1,1000000)
insert into sensor_data(ts,sid,val) values (clock_timestamp(), :sid, random()*1000);
每次合并5万条
vi lambda1.sql
insert into sensor_lastdata select sid, (array_agg(ts order by pk desc))[1] as last_ts, (array_agg(val order by pk desc))[1] as last_val from unnest(get_sensor_data(50000)) group by sid on conflict (sid) do update set last_ts=excluded.last_ts,last_val=excluded.last_val;
写入约10万条/s。
```
pgbench -M prepared -n -r -P 1 -f ./ins.sql -c 64 -j 64 -T 120
transaction type: ./ins.sql
scaling factor: 1
query mode: prepared
number of clients: 64
number of threads: 64
duration: 120 s
number of transactions actually processed: 12742596
latency average = 0.603 ms
latency stddev = 2.163 ms
tps = 106184.095420 (including connections establishing)
tps = 106188.650794 (excluding connections establishing)
script statistics:
- statement latencies in milliseconds:
0.001 \set sid random(1,1000000)
0.602 insert into sensor_data(ts,sid,val) values (clock_timestamp(), :sid, random()*1000);
```
增量消费,并更新最新值约5万条/s。
```
pgbench -M prepared -n -r -P 1 -f ./lambda1.sql -c 1 -j 1 -T 1200
progress: 236.0 s, 1.0 tps, lat 649.196 ms stddev 0.000
progress: 237.0 s, 2.0 tps, lat 868.952 ms stddev 6.024
progress: 238.0 s, 1.0 tps, lat 728.553 ms stddev 0.000
progress: 239.0 s, 258.1 tps, lat 5.335 ms stddev 44.167
progress: 240.0 s, 850.9 tps, lat 0.983 ms stddev 14.506
progress: 241.0 s, 7962.2 tps, lat 0.146 ms stddev 3.672
progress: 242.0 s, 13488.1 tps, lat 0.074 ms stddev 0.006
postgres=# select count(*) from sensor_data;
count
0复制
(1 row)
postgres=# select * from sensor_lastdata limit 10;
sid | last_ts | last_val
------+----------------------------+----------
672 | 2017-05-18 16:33:43.569255 | 196.01
178 | 2017-05-18 16:33:31.23651 | 593.16
686 | 2017-05-18 16:33:38.792138 | 762.95
4906 | 2017-05-18 16:33:43.498217 | 150.13
544 | 2017-05-18 16:33:45.338635 | 410.31
165 | 2017-05-18 16:33:28.393902 | 678.75
625 | 2017-05-18 16:33:37.077898 | 229.06
1316 | 2017-05-18 16:33:45.218268 | 27.55
3091 | 2017-05-18 16:33:33.320828 | 697.75
340 | 2017-05-18 16:33:31.567852 | 24.18
(10 rows)
```
每批统计10万时,性能可以略微提升
progress: 211.0 s, 1.0 tps, lat 1428.401 ms stddev 0.000
progress: 212.0 s, 0.0 tps, lat -nan ms stddev -nan
progress: 213.0 s, 1.0 tps, lat 1375.766 ms stddev 0.000
progress: 214.0 s, 2665.9 tps, lat 0.699 ms stddev 23.234
progress: 215.0 s, 8963.1 tps, lat 0.083 ms stddev 0.008
progress: 216.0 s, 1699.4 tps, lat 0.741 ms stddev 12.434
progress: 217.0 s, 13247.9 tps, lat 0.075 ms stddev 0.006
压测2,实时写入,并批量增量统计传感器的值
每次合并10万条
vi lambda2.sql
insert into sensor_aggdata (sid,ts_group,sum_val,min_val,max_val,avg_val,count_val,all_vals) select sid,to_char(ts,'yyyymmddhh24'),sum(val),min(val),max(val),avg(val),count(val),array_agg(val order by pk) from unnest(get_sensor_data(100000))   group by sid,to_char(ts,'yyyymmddhh24')  on conflict (sid,ts_group) do update set     sum_val=sensor_aggdata.sum_val+excluded.sum_val,    min_val=least(sensor_aggdata.min_val, excluded.min_val),    max_val=greatest(sensor_aggdata.max_val, excluded.max_val),    avg_val=(sensor_aggdata.sum_val+excluded.sum_val)/(sensor_aggdata.count_val+excluded.count_val),    count_val=sensor_aggdata.count_val+excluded.count_val,    all_vals=array_cat(sensor_aggdata.all_vals, excluded.all_vals);
写入约10万条/s。
```
pgbench -M prepared -n -r -P 1 -f ./ins.sql -c 64 -j 64 -T 120
transaction type: ./ins.sql
scaling factor: 1
query mode: prepared
number of clients: 64
number of threads: 64
duration: 120 s
number of transactions actually processed: 12753950
latency average = 0.602 ms
latency stddev = 2.733 ms
tps = 106272.985233 (including connections establishing)
tps = 106277.604416 (excluding connections establishing)
script statistics:
- statement latencies in milliseconds:
0.001 \set sid random(1,1000000)
0.601 insert into sensor_data(ts,sid,val) values (clock_timestamp(), :sid, random()*1000);
```
增量消费,并统计约4.4万条/s。
```
pgbench -M prepared -n -r -P 1 -f ./lambda2.sql -c 1 -j 1 -T 1200
progress: 287.0 s, 1.0 tps, lat 2107.584 ms stddev 0.000
progress: 288.0 s, 0.0 tps, lat -nan ms stddev -nan
progress: 289.0 s, 100.1 tps, lat 29.854 ms stddev 213.634
progress: 290.0 s, 1855.0 tps, lat 0.540 ms stddev 5.677
progress: 291.0 s, 8447.0 tps, lat 0.118 ms stddev 0.005
postgres=# select * from sensor_aggdata limit 10;
sid | ts_group | sum_val | min_val | max_val | avg_val | count_val | all_vals
--------+------------+----------+---------+---------+---------+-----------+--------------------------------------------------------------------------------
6 | 2017051816 | 1842.71 | 42.47 | 577.09 | 307.12 | 6 | {42.47,559.47,577.09,193.62,75.74,394.32}
2 | 2017051816 | 5254.01 | 69.98 | 861.77 | 437.83 | 12 | {628.03,77.15,662.74,69.98,337.83,563.70,750.44,423.81,158.27,861.77,649.27,71.02}
226 | 2017051816 | 2756.42 | 144.00 | 680.45 | 344.55 | 8 | {350.57,144.00,194.23,352.52,680.45,302.66,420.01,311.98}
509 | 2017051816 | 6235.10 | 44.98 | 939.43 | 566.83 | 11 | {939.43,598.33,741.12,535.66,44.98,732.00,694.66,440.00,327.80,312.98,868.14}
20 | 2017051816 | 4684.00 | 7.01 | 878.64 | 425.82 | 11 | {209.70,288.67,76.35,544.31,289.33,7.01,841.21,878.64,418.05,651.01,479.72}
934042 | 2017051816 | 10210.41 | 46.44 | 945.59 | 486.21 | 21 | {235.86,656.24,450.73,945.59,932.06,256.10,46.44,903.74,694.43,713.79,523.25,325.82,333.67,603.01,743.63,137.48,238.60,321.65,466.50,70.49,611.33}
960 | 2017051816 | 3621.60 | 20.59 | 895.01 | 603.60 | 6 | {347.70,876.07,895.01,20.59,871.64,610.59}
81 | 2017051816 | 4209.38 | 459.06 | 949.42 | 701.56 | 6 | {716.38,949.42,706.20,459.06,613.36,764.96}
723065 | 2017051816 | 7176.00 | 12.37 | 983.84 | 512.57 | 14 | {869.29,715.48,323.42,595.29,983.84,700.06,716.37,741.55,137.88,12.37,334.74,951.94,46.85,46.92}
77 | 2017051816 | 5394.54 | 87.43 | 872.90 | 490.41 | 11 | {301.87,777.52,872.90,219.96,87.43,525.80,308.87,509.80,383.90,608.52,797.97}
(10 rows)
```
2. 流式计算
流式计算,使用PipelineDB,创建stream(即明细表),然后创建实时更新表,以及统计表。
1. 创建传感器明细数据stream。
```
create sequence seq; -- 创建PK序列
pipeline=# create stream sensor_data(
pk int8, -- 用于排序,取最新值的PK
ts timestamp, -- 时间戳
sid int, -- 传感器ID
val numeric(10,2) -- 值
);
CREATE STREAM
```
2. 创建实时更新传感器最新值的CONTINUOUS VIEW
请使用pipelinedb独有的获取分组最新值的聚合函数
```
keyed_max ( key, value )
Returns the value associated with the “highest” key.
keyed_min ( key, value )
Returns the value associated with the “lowest” key.
```
请勿使用(array_agg(ts order by pk desc))[1],pipelinedb对agg(order by)支持不好
```
-- pipelinedb目前对agg(order by)支持不佳,测试写入时报错
CREATE CONTINUOUS VIEW sensor_lastdata1 AS
select sid, (array_agg(ts order by pk desc))[1] as last_ts, (array_agg(val order by pk desc))[1] as last_val
from sensor_data
group by sid;
-- 1. 请使用这个SQL代替上面的SQL
CREATE CONTINUOUS VIEW sensor_lastdata1 AS
select sid, keyed_max(pk, ts) as last_ts, keyed_max(pk, val) as last_val
from sensor_data
group by sid;
-- pipelinedb目前不支持window function,使用keyed_max, keyed_min代替。
CREATE CONTINUOUS VIEW sensor_lastdata2 AS
select sid,ts as last_ts,val as last_val from sensor_data
where row_number() over(partition by sid order by pk desc)=1;
ERROR: subqueries in continuous views cannot contain window functions
```
3. 创建实时统计传感器数值,以及明细聚合的CONTINUOUS VIEW
```
-- pipelinedb目前对agg(order by)支持不佳,测试写入时报错
CREATE CONTINUOUS VIEW sensor_aggdata1 AS
select
sid,
to_char(ts,'yyyymmddhh24') as ts_group,
sum(val) as sum_val,
min(val) as min_val,
max(val) as max_val,
avg(val) as avg_val,
count(val) as count_val,
array_agg(val order by pk) as all_vals
from sensor_data
group by sid,to_char(ts,'yyyymmddhh24');
-- 2. 请使用这个SQL代替上面的SQL
CREATE CONTINUOUS VIEW sensor_aggdata1 AS
select
sid,
to_char(ts,'yyyymmddhh24') as ts_group,
sum(val) as sum_val,
min(val) as min_val,
max(val) as max_val,
avg(val) as avg_val,
count(val) as count_val,
jsonb_object_agg (pk, val) as all_vals
from sensor_data
group by sid,to_char(ts,'yyyymmddhh24');
```
4. 激活CONTINUOUS VIEW
pipeline=# activate sensor_lastdata1;
ACTIVATE
pipeline=# activate sensor_aggdata1;
ACTIVATE
压测
```
vi ins.sql
\set sid random(1,1000000)
insert into sensor_data(pk,ts,sid,val) values (nextval('seq'), clock_timestamp(), :sid, random()*1000);
```
pipelinedb目前对agg(order by)支持不佳的报错,如果你没有使用替代SQL,会收到如下报错。
```
/home/digoal/pgsql10/bin/pgbench -M prepared -n -r -P 1 -f ./ins.sql -c 1 -j 1 -T 100
progress: 1.0 s, 12.0 tps, lat 1.302 ms stddev 0.455
WARNING: a background worker crashed while processing this batch
HINT: Some of the tuples inserted in this batch might have been lost.
progress: 2.0 s, 16.0 tps, lat 70.528 ms stddev 253.719
WARNING: a background worker crashed while processing this batch
HINT: Some of the tuples inserted in this batch might have been lost.
WARNING: a background worker crashed while processing this batch
HINT: Some of the tuples inserted in this batch might have been lost.
WARNING: a background worker crashed while processing this batch
HINT: Some of the tuples inserted in this batch might have been lost.
```
使用替代SQL,压测结果:
1. 聚合values,压测结果:
写入速度12.7万/s。
```
/home/digoal/pgsql10/bin/pgbench -M prepared -n -r -P 1 -f ./ins.sql -c 256 -j 256 -T 100
transaction type: ./ins.sql
scaling factor: 1
query mode: prepared
number of clients: 256
number of threads: 256
duration: 100 s
number of transactions actually processed: 12840629
latency average = 1.994 ms
latency stddev = 14.671 ms
tps = 127857.131372 (including connections establishing)
tps = 127864.890658 (excluding connections establishing)
script statistics:
- statement latencies in milliseconds:
0.001 \set sid random(1,1000000)
1.997 insert into sensor_data(pk,ts,sid,val) values (nextval('seq'), clock_timestamp(), :sid, random()*1000);
```
pipeline=# select * from sensor_aggdata1 limit 10;
-[ RECORD 1 ]----------------------------------------------------------------------------------------------------------------------------------------------
sid       | 444427
ts_group  | 2017052410
sum_val   | 4902.07
min_val   | 18.69
max_val   | 980.26
avg_val   | 445.6427272727272727
count_val | 11
all_vals  | {"41971591": 731.45, "42075280": 69.63, "42629210": 980.26, "45243895": 18.69, "45524545": 320.88, "46971341": 741.88, "47036195": 357.47, "47895869": 562.16, "49805560": 136.78, "51753795": 344.00, "53039367": 638.87}
2. 不聚合VALUES,压测结果:
写入速度20万/s。
CREATE CONTINUOUS VIEW sensor_aggdata2 AS
  select
  sid,
  to_char(ts,'yyyymmddhh24') as ts_group,
  sum(val) as sum_val,
  min(val) as min_val,
  max(val) as max_val,
  avg(val) as avg_val,
  count(val) as count_val
  -- jsonb_object_agg (pk, val) as all_vals
    from sensor_data
  group by sid,to_char(ts,'yyyymmddhh24');
```
/home/digoal/pgsql10/bin/pgbench -M prepared -n -r -P 1 -f ./ins.sql -c 256 -j 256 -T 100
transaction type: ./ins.sql
scaling factor: 1
query mode: prepared
number of clients: 256
number of threads: 256
duration: 100 s
number of transactions actually processed: 20940292
latency average = 1.222 ms
latency stddev = 0.423 ms
tps = 208834.531839 (including connections establishing)
tps = 208854.792937 (excluding connections establishing)
script statistics:
- statement latencies in milliseconds:
0.001 \set sid random(1,1000000)
1.222 insert into sensor_data(pk,ts,sid,val) values (nextval('seq'), clock_timestamp(), :sid, random()*1000);
pipeline=# select * from sensor_aggdata2;
sid | ts_group | sum_val | min_val | max_val | avg_val | count_val
------+------------+-------------+---------+---------+----------------------+-----------
196 | 2017051815 | 11462397.00 | 0.00 | 999.99 | 503.1780948200175593 | 22780
833 | 2017051815 | 11479990.49 | 0.07 | 999.99 | 498.4365443730461966 | 23032
700 | 2017051815 | 11205820.52 | 0.04 | 999.97 | 497.1967574762623125 | 22538
83 | 2017051815 | 11466423.01 | 0.01 | 999.93 | 501.3959075604530150 | 22869
526 | 2017051815 | 11389541.40 | 0.01 | 999.99 | 503.4496485877204615 | 22623
996 | 2017051815 | 11416373.92 | 0.03 | 999.99 | 502.1938996172964413 | 22733
262 | 2017051815 | 11458700.05 | 0.03 | 999.98 | 499.5509656465254163 | 22938
542 | 2017051815 | 11365373.33 | 0.00 | 999.95 | 499.6427366246098387 | 22747
......
```
3. 实时
实时的写入明细,同步更新最终状态。
(同步统计不推荐使用,对写入的RT性能影响比较大)
实时更新传感器最终状态表
create table sensor_lastdata(
  sid int primary key,
  last_ts timestamp,
  last_val numeric(10,2)
);
压测1,更新传感器实时状态
```
vi ins.sql
\set sid random(1,1000000)
insert into sensor_lastdata values (:sid, now(), random()*1000) on conflict (sid) do update set last_ts=excluded.last_ts,last_val=excluded.last_val;
```
性能,约18万/s。
```
/home/digoal/pgsql10/bin/pgbench -M prepared -n -r -P 1 -f ./ins.sql -c 128 -j 128 -T 100
transaction type: ./ins.sql
scaling factor: 1
query mode: prepared
number of clients: 128
number of threads: 128
duration: 100 s
number of transactions actually processed: 18659587
latency average = 0.686 ms
latency stddev = 2.566 ms
tps = 186557.140033 (including connections establishing)
tps = 186565.458460 (excluding connections establishing)
script statistics:
- statement latencies in milliseconds:
0.001 \set sid random(1,1000000)
0.684 insert into sensor_lastdata values (:sid, now(), random()*1000) on conflict (sid) do update set last_ts=excluded.last_ts,last_val=excluded.last_val;
```
三种方案对比
性能对比
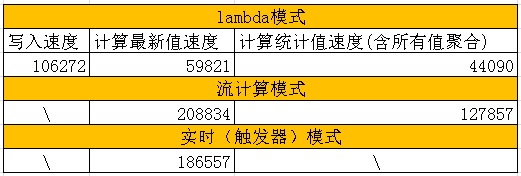
1. 写入明细记录的速度
lambda方式:10.6万/s
流计算方式(含val明细聚合):12.78万/s
流计算方式(不含val明细聚合):20.8万/s
2. 更新最终状态速度
lambda方式:5.98万/s
实时方式:18.6万/s
流计算方式:20.8万/s
3. 统计速度
lambda方式(含val明细聚合):4.4万/s
流计算方式(含val明细聚合):12.78万/s
流计算方式(不含val明细聚合):20.8万/s
优劣与适用场合对比
1. lambda方式
性能中规中矩,通过UDF + 增量调度,支持所有的统计模式。
目前这个方案有成熟的用户案例(某大数据平台),支持了每天数TB的数据准实时统计。
同时也期待PG社区开发这样的功能:
delete from table order by pk limit xxx skip locked returning array_agg(ts),array_agg(val) group by sid;
这种QUERY将以最小的开销,从数据中删除并返回一批记录。相比本例,也许能提升一倍性能。
2. 流计算方式
性能最高,使用也便利,推荐使用。
将来pipelinedb插件化之后,使用起来就更加方便了。
3. 实时方式
如果只是用来更新最终状态,建议使用,开发工作量最少,不需要调度。
参考
《PostgreSQL upsert功能(insert on conflict do)的用法》
《PostgreSQL 如何实现upsert与新旧数据自动分离》
《[转载]postgresql 9.5版本之前实现upsert功能》
《流计算风云再起 - PostgreSQL携PipelineDB力挺IoT》
http://docs.pipelinedb.com/streams.html
PostgreSQL 许愿链接
您的愿望将传达给PG kernel hacker、数据库厂商等, 帮助提高数据库产品质量和功能, 说不定下一个PG版本就有您提出的功能点. 针对非常好的提议,奖励限量版PG文化衫、纪念品、贴纸、PG热门书籍等,奖品丰富,快来许愿。开不开森.
9.9元购买3个月阿里云RDS PostgreSQL实例
PostgreSQL 解决方案集合
德哥 / digoal's github - 公益是一辈子的事.


