


作者
digoal
日期
2016-09-26
标签
PostgreSQL , pgbench , rt
背景
使用pgbench测试数据库性能时,在输出的报告中,可以输出事务的平均RT,以及单条SQL的平均RT。
那么这两个有什么分别呢?
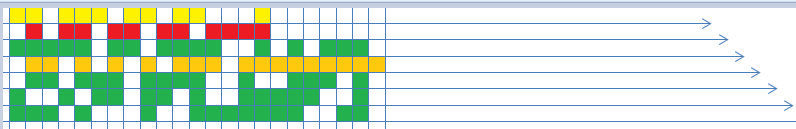
每行代表一个线程,被填充了颜色的部分表示从客户端发起SQL到SQL返回的时间窗口,没有填充颜色的部分表示线程的空闲时间。
如何统计事务 平均RT :
执行的事务数/总的测试时长
如何统计SQL 平均RT :
每条SQL的执行时长累加/总的SQL执行次数
从计算公式以及图例来分析,显然SQL的平均RT会更低,因为没有计算线程的空闲时间。
特别是pgbench与数据库在同一主机进行测试时,全力压测(CPU吃满)的情况下,PGBENCH的线程等待(空闲)时间会更明显,SQL的RT会比事务的RT低很多。
那么哪个值更能代表数据库的处理能力呢?
SQL平均RT可以代表数据库的真实处理能力,而事务RT则是代表从客户端到数据库端作为一个整体来看待的事务处理能力(包括客户端的处理时间,数据库的处理时间,以及网络传输时间)。
pgbench 相关源码浅析
不加 -r 参数
返回样例如下
transaction type: TPC-B (sort of)
scaling factor: 100
query mode: prepared
number of clients: 10
number of threads: 10
duration: 10 s
number of transactions actually processed: 29032
latency average: 3.442 ms
latency stddev: 74.879 ms
tps = 2902.936994 (including connections establishing)
tps = 2903.710037 (excluding connections establishing)
代码如下
打印事务RT(或脚本RT)为 测试的持续时长 除以 总的事务数
/* only an average latency computed from the duration is available */
                printf("latency average: %.3f ms\n",
                           1000.0 * duration * nclients / total->cnt);
加 -r 参数
-r, --report-latencies report average latency per command
返回样例如下
transaction type: TPC-B (sort of)
scaling factor: 100
query mode: prepared
number of clients: 10
number of threads: 10
duration: 10 s
number of transactions actually processed: 22000
latency average: 5.634 ms
latency stddev: 191.632 ms
tps = 1773.794731 (including connections establishing)
tps = 1774.193277 (excluding connections establishing)
statement latencies in milliseconds:
        0.003053        \set nbranches 1 * :scale
        0.000832        \set ntellers 10 * :scale
        0.000661        \set naccounts 100000 * :scale
        0.001120        \setrandom aid 1 :naccounts
        0.000909        \setrandom bid 1 :nbranches
        0.000742        \setrandom tid 1 :ntellers
        0.000773        \setrandom delta -5000 5000
        0.053747        BEGIN;
        0.183235        UPDATE pgbench_accounts SET abalance = abalance + :delta WHERE aid = :aid;
        0.092281        SELECT abalance FROM pgbench_accounts WHERE aid = :aid;
        0.113678        UPDATE pgbench_tellers SET tbalance = tbalance + :delta WHERE tid = :tid;
        0.155755        UPDATE pgbench_branches SET bbalance = bbalance + :delta WHERE bid = :bid;
        0.088806        INSERT INTO pgbench_history (tid, bid, aid, delta, mtime) VALUES (:tid, :bid, :aid, :delta, CURRENT_TIMESTAMP);
        4.929969        END;
代码浅析
参数
-r
                        case 'r':
                                benchmarking_option_set = true;
                                per_script_stats = true;
                                is_latencies = true;
                                break;
语句开始时间
instr_time      stmt_begin;             /* used for measuring statement latencies */
......
        /* Record statement start time if per-command latencies are requested */
        if (is_latencies)
                INSTR_TIME_SET_CURRENT(st->stmt_begin);
累加语句的执行时间
```
/
* command finished: accumulate per-command execution times in
* thread-local data structure, if per-command latencies are requested
/
if (is_latencies)
{
if (INSTR_TIME_IS_ZERO(now))
INSTR_TIME_SET_CURRENT(now);
/* XXX could use a mutex here, but we choose not to */ addToSimpleStats(&commands[st->state]->stats, INSTR_TIME_GET_DOUBLE(now) - INSTR_TIME_GET_DOUBLE(st->stmt_begin)); }复制
...... / * Accumulate one value into a SimpleStats struct. / static void addToSimpleStats(SimpleStats *ss, double val) { if (ss->count == 0 || val < ss->min) ss->min = val; if (ss->count == 0 || val > ss->max) ss->max = val; ss->count++; ss->sum += val; ss->sum2 += val * val; } ```
数据结构
```
/
* Simple data structure to keep stats about something.
*
* XXX probably the first value should be kept and used as an offset for
* better numerical stability...
/
typedef struct SimpleStats
{
int64 count; / how many values were encountered /
double min; / the minimum seen /
double max; / the maximum seen /
double sum; / sum of values /
double sum2; / sum of squared values /
} SimpleStats;
/ * Data structure to hold various statistics: per-thread and per-script stats * are maintained and merged together. / typedef struct StatsData { long start_time; / interval start time, for aggregates / int64 cnt; / number of transactions / int64 skipped; / number of transactions skipped under --rate * and --latency-limit / SimpleStats latency; SimpleStats lag; } StatsData; ```
打印语句的RT (语句的累计时间 除以 语句的调用次数)
```
/ Report per-command latencies /
if (is_latencies)
{
Command **commands;
printf(" - statement latencies in milliseconds:\n"); for (commands = sql_script[i].commands; *commands != NULL; commands++) printf(" %11.3f %s\n", 1000.0 * (*commands)->stats.sum / (*commands)->stats.count, (*commands)->line); }复制
```
PostgreSQL 许愿链接
您的愿望将传达给PG kernel hacker、数据库厂商等, 帮助提高数据库产品质量和功能, 说不定下一个PG版本就有您提出的功能点. 针对非常好的提议,奖励限量版PG文化衫、纪念品、贴纸、PG热门书籍等,奖品丰富,快来许愿。开不开森.
9.9元购买3个月阿里云RDS PostgreSQL实例
PostgreSQL 解决方案集合
德哥 / digoal's github - 公益是一辈子的事.

