


作者
digoal
日期
2017-04-09
标签
PostgreSQL , 监控平台 , ganglia , zabbix , nagios , Prometheus , GO
背景
What is Prometheus?
Prometheus is an open-source systems monitoring and alerting toolkit originally built at SoundCloud. Since its inception in 2012, many companies and organizations have adopted Prometheus, and the project has a very active developer and user community. It is now a standalone open source project and maintained independently of any company. To emphasize this and clarify the project's governance structure, Prometheus joined the Cloud Native Computing Foundation in 2016 as the second hosted project after Kubernetes.
For a more elaborate overview, see the resources linked from the media section.
是一个非常活跃的项目, 结合PostgreSQL的时序数据和流式计算,会更好。
架构
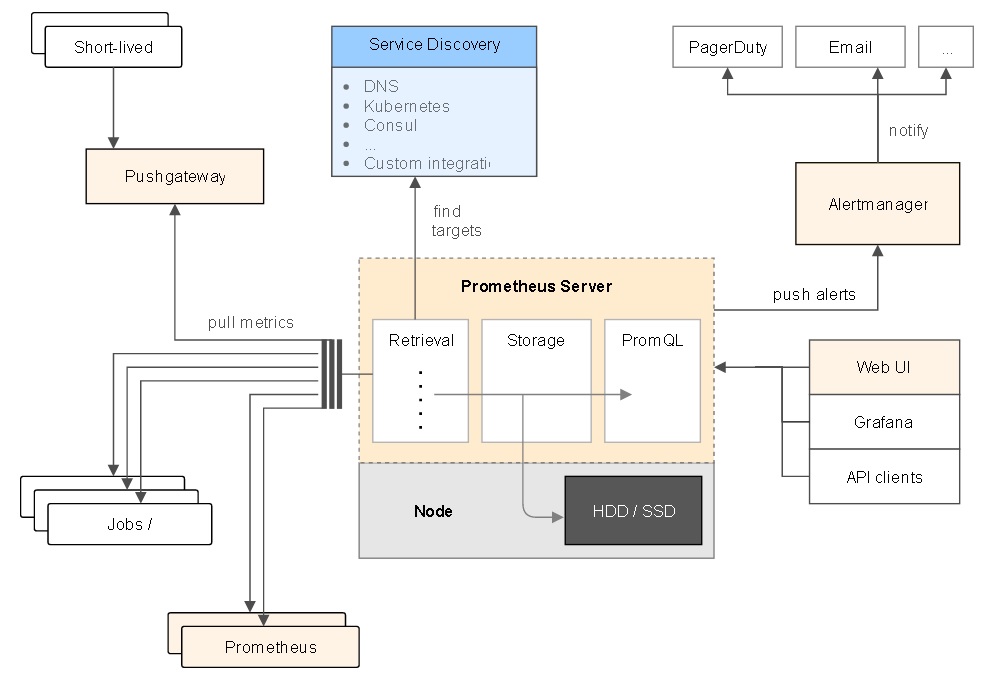
ppt
参考
https://prometheus.io/docs/introduction/overview/
https://prometheus.io/docs/introduction/getting_started/
https://github.com/prometheus/prometheus
PostgreSQL 许愿链接
您的愿望将传达给PG kernel hacker、数据库厂商等, 帮助提高数据库产品质量和功能, 说不定下一个PG版本就有您提出的功能点. 针对非常好的提议,奖励限量版PG文化衫、纪念品、贴纸、PG热门书籍等,奖品丰富,快来许愿。开不开森.
9.9元购买3个月阿里云RDS PostgreSQL实例
PostgreSQL 解决方案集合
德哥 / digoal's github - 公益是一辈子的事.

