


系统环境:Centos5.6+11.2.0.3.0 RAC+DG
数据库症状:频繁报错07445,hang死一段时间后自动重启。
注:报错与解决过程与一篇文章一致,当时情况紧急未做过多记录,事后懒于整理且由于搜索不到原作者,现粘贴出文章链接:http://www.bubuko.com/infodetail-538769.html
报错信息日志如下:
Exception [type: SIGSEGV, Address not mapped to object] [ADDR:0x30500AEF6E9] [PC:0x9379C98, kglic0()+1086] [flags: 0x0, count: 1]
Errors in file /u01/app/oracle/diag/rdbms/******/trace/pos2_m000_31935.trc (incident=201585):
ORA-07445: exception encountered: core dump [kglic0()+1086] [SIGSEGV] [ADDR:0x30500AEF6E9] [PC:0x9379C98] [Address not mapped to object] []
Incident details in: /u01/app/oracle/diag/rdbms/******/incident/incdir_201585/pos2_m000_31935_i201585.trc
Use ADRCI or Support Workbench to package the incident.
See Note 411.1 at My Oracle Support for error and packaging details.
Wed Jun 29 12:00:57 2016
Dumping diagnostic data in directory=[cdmp_20160629120057], requested by (instance=2, osid=31935 (M000)), summary=[incident=201585].
Wed Jun 29 12:01:04 2016
Sweep [inc][201585]: completed
Sweep [inc2][201585]: completed
Errors in file /u01/app/oracle/diag/rdbms/******/trace/pos2_m000_21321.trc (incident=201529):
ORA-04030: out of process memory when trying to allocate 8528 bytes (pga heap,kgh stack)
Incident details in: /u01/app/oracle/diag/rdbms/******/incident/incdir_201529/pos2_m000_21321_i201529.trc
Use ADRCI or Support Workbench to package the incident.
See Note 411.1 at My Oracle Support for error and packaging details.
Errors in file /u01/app/oracle/diag/rdbms/******/trace/pos2_m000_21321.trc (incident=201530):
ORA-04030: out of process memory when trying to allocate 8528 bytes (pga heap,kgh stack)
ORA-04030: out of process memory when trying to allocate 8528 bytes (pga heap,kgh stack)
Incident details in: /u01/app/oracle/diag/rdbms/******/incident/incdir_201530/pos2_m000_21321_i201530.trc
Use ADRCI or Support Workbench to package the incident.
See Note 411.1 at My Oracle Support for error and packaging details.
Use ADRCI or Support Workbench to package the incident.
See Note 411.1 at My Oracle Support for error and packaging details.
Wed Jun 29 13:00:15 2016
Sweep [inc][201530]: completed
Sweep [inc][201529]: completed
Sweep [inc2][201530]: completed
Exception [type: SIGSEGV, Address not mapped to object] [ADDR:0x76900B2986F] [PC:0x9379C98, kglic0()+1086] [flags: 0x0, count: 1]
Errors in file /u01/app/oracle/diag/rdbms/pos/pos2/trace/pos2_m000_16646.trc (incident=201713):
ORA-07445: exception encountered: core dump [kglic0()+1086] [SIGSEGV] [ADDR:0x76900B2986F] [PC:0x9379C98] [Address not mapped to object] []
Incident details in: /u01/app/oracle/diag/rdbms/******/incident/incdir_201713/pos2_m000_16646_i201713.trc
Use ADRCI or Support Workbench to package the incident.
See Note 411.1 at My Oracle Support for error and packaging details.
Wed Jun 29 14:00:16 2016
Dumping diagnostic data in directory=[cdmp_20160629140016], requested by (instance=2, osid=16646 (M000)), summary=[incident=201713].
Wed Jun 29 14:02:14 2016
PMON failed to acquire latch, see PMON dump
Wed Jun 29 14:02:31 2016
LCK0 (ospid: 16997) waits for latch 'shared pool' for 98 secs.
Errors in file /u01/app/oracle/diag/rdbms/******/trace/pos2_lmhb_16893.trc (incident=201345):
ORA-29771: process USER (OSID 17589) blocks LCK0 (OSID 16997) for more than 70 seconds
Incident details in: /u01/app/oracle/diag/rdbms/******/incident/incdir_201345/pos2_lmhb_16893_i201345.trc
USER (ospid: 17589) is blocking LCK0 (ospid: 16997) in a wait
LMHB (ospid: 16893) kills USER (ospid: 17589).
Please check LMHB trace file for more detail.
Wed Jun 29 14:03:14 2016
PMON failed to acquire latch, see PMON dump
Wed Jun 29 14:03:51 2016
LCK0 (ospid: 16997) waits for latch 'shared pool' for 179 secs.
Errors in file /u01/app/oracle/diag/rdbms/******/trace/pos2_lmhb_16893.trc (incident=201346):
ORA-29771: process USER (OSID 17597) blocks LCK0 (OSID 16997) for more than 70 seconds
Incident details in: /u01/app/oracle/diag/rdbms/******/incident/incdir_201346/pos2_lmhb_16893_i201346.trc
USER (ospid: 17597) is blocking LCK0 (ospid: 16997) in a wait
LMHB (ospid: 16893) kills USER (ospid: 17597).
Please check LMHB trace file for more detail.
Wed Jun 29 14:04:15 2016
PMON (ospid: 16818): terminating the instance due to error 474
Wed Jun 29 14:04:15 2016
System state dump requested by (instance=2, osid=16818 (PMON)), summary=[abnormal instance termination].
Wed Jun 29 14:04:15 2016
opiodr aborting process unknown ospid (17007) as a result of ORA-1092
System State dumped to trace file /u01/app/oracle/diag/rdbms/******/trace/pos2_diag_16837.trc
Wed Jun 29 14:04:15 2016
ORA-1092 : opitsk aborting process
Wed Jun 29 14:04:16 2016
ORA-1092 : opitsk aborting process
Wed Jun 29 14:04:16 2016
License high water mark = 538
Instance terminated by PMON, pid = 16818
USER (ospid: 21080): terminating the instance
Instance terminated by USER, pid = 21080
接下来就是频繁报错频繁重启过程。
解决过程:
查询oracle官方文档,发现是11.2.0.3的一个bug,bug现象与我的报错信息一致。
此bug的触发条件与我的一样:
版本为11gR2的3版本
由于07445报错的信息有很多种,此bug的信息为ORA-07445: exception encountered: core dump [kglic0()+1086] ...这与我的日志报错信息一致。
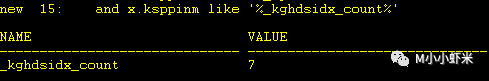
从alter日志中查看trace文件,有kksIterCursorStat提示
_kghdsidx_count值>1
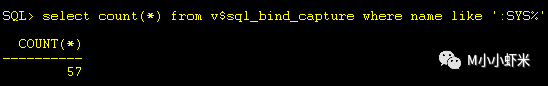
查询select count(*) from v$sql_bind_capture where name like ':SYS%';总数>0
处理:根据官方文档的处理意见,修改隐含参数"_kghdsidx_count"=1,重启数据库服务可以解决此问题。
另外根据官方文档中的延伸说明:Bug 12340939 ORA-7445 [kglic0] can occur capturing cursor stats for V$SQLSTATS也可能会触发该问题,修改隐含参数"_cursor_stats_enabled"=FALSE,重启数据库服务可以解决此问题。
