


A_Method_of_Data_Distribution_for_Distributed_Cross_Join.pdf
免费下载

A Method of Data Distribution for Distributed
Cross Join
Ping Lu
∗†
, Shengmei Luo
†
, Zhiping Wang
†
,Wenwu Qu
†
{lu.ping, luo.shengmei, wang.zhiping1,qu.wenwu} @zte.com.cn
∗
Southeast University
†
ZTE Corporation
Abstract—One of the major challenges in big data processing
is the efficiency of cross join, such as the similarity calculation in
business intelligence. In this paper we introduce an optimal data
distribution algorithm for distributed cross join which combine
each row from the first table with each row from the second
table, which can reduce the network traffic and guarantee the
computation balance of the distributed system.
I. INTRODUCTION
Big data has emerged as one of the most visible topics
in technology today. As with other trends such as mobile,
social and cloud computing, big data represents both business
opportunities and technical challenges. Organizations of all
types are extracting increased value from large data sets that
come from real-time data streams, video, mobile Internet, and
many other sources.
However, handling this data is not easy. Big data must not
only be stored, it also be transmitted, processed and reused by
a variety of applications. This means big data impacts every-
thing in the entire IT stack, including servers, storage[1][2],
computation middleware[3][4][5] and applications[6][8][7].
One of the major challenges in big data processing is the
computation of joins, which have been studies in recent years
[9][10][11].
Although different joins are optimized by different methods,
cross join which is also called broadcast join, as one kind
of joins which returns the Cartesian product of rows from
tables , is only support that one of the two tables is small
enough to be stored in the memory. At ZTE the application
of recommendation system, which has users more than tens
of millions, needs to calculate the similarity between users.
The storage of user information is close to 1T, so it can not
be stored in the memory. It will lead to network traffic if the
computation is realized using the method. Usually, a big table
is stored in the storage system using the form of sub-tables
with the same size, which is called block in hadoop system.
The implementation of the cross join between two big tables
is to cross join each sub-table of the first table with all sub-
tables of the second table. The method needs to duplicate all
the sub-tables of the smaller table on each node, which usually
tends to cause a bottleneck of network traffic.
In this paper, we propose a sub-table distribution algorithm
for distributed cross join which can reduce the network traffic
on the basis of the computation balance of the distributed
system. In the implementation of cross join, we only copy
a part of sub-tables of the two tables on each node just to
meet the demand of the computation. In the experiments we
will show that the algorithm can reduce the network traffic
effectively for cross join of two big table.
The paper is organized as follows. In the next section, we
introduce the data distribution model of cross join. Next, we
present the algorithm of data distribution and the optimization
in Section 3. We then continue with a presentation of the
experiment of our algorithm in Section 4, and the conclusion
in Section 5.
II. D
ATA DISTRIBUTION MODEL
Assume there are two big tables of TableA and TableB with
the sub-tables of NumTa and NumTb, respectively. There is
a cluster consists of same physical nodes with the number
of NumNode. Without loss of generality, we assume all the
sub-tables have the same size, and NumTa is not smaller than
NumTb. Consider the cross join of TableA and TableB, which
means that each sub-table of TableA need to cross join with
all sub-tables of TableB.
In traditional solution, the larger table’s sub-tables are
evenly in the cluster and the smaller table’s sub-tables are
duplicated on each node. Then the network traffic will be Num-
Ta+ NumTb* NumNode. Each node has (NumTa /NumNode)
TableA’s sub-tables and (NumTb) TableB’s sub-tables, so the
computing capacity of a node is (NumTa /NumNode)* NumTb.
On the condition of not reduce each node’s computing
capacity, we propose a new solution of sub-table distribution in
the cluster. We make the number of sub-tables of both tables on
each node similar to
NumT a ∗ NumT b/NumNode.Then
the network traffic is 2
(NumT a ∗ NumT b ∗ NumNode.
However, the solution brings a new problem that we must
ensure in the cluster each sub-table of TableA needs cross
join with each sub-table of TableB. We solve the problem by
transmitting the sub-tables of both Tables on the appropriate
nodes which is described in the algorithm 1 and 2.
Assume k= NumTa/NumTb, then we can get the ra-
tio of the network traffic with the traditional solution,
2
√
k ∗ NumNode/(k + NumNode). We can see that if the
values of k and NumNode are close, the network traffic of
the two solutions are similar. Otherwise, the larger of the
difference between k and NumNode, the traditional solution
will consume more network traffic. For example, when k is
2013 International Conference on Advanced Cloud and Big Data
978-1-4799-3261-0/14 $31.00 © 2014 IEEE
DOI 10.1109/CBD.2013.5
105
Authorized licensed use limited to: ZTE CORPORATION. Downloaded on July 18,2023 at 08:12:19 UTC from IEEE Xplore. Restrictions apply.
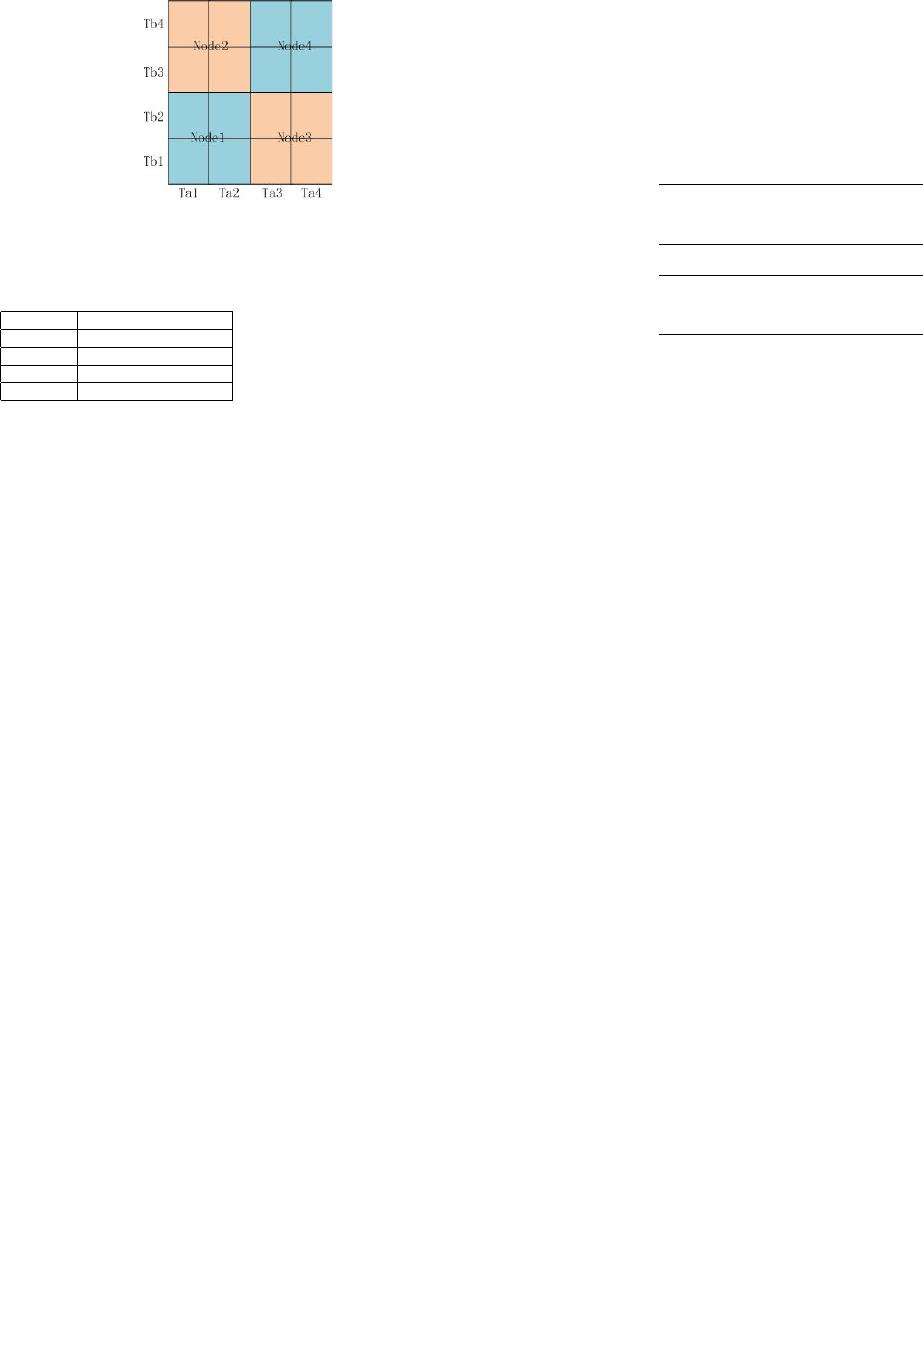
Fig. 1. A coverage solution of a 4*4 rectangle with 4 nodes
TABLE I
S
UB-TABLE DISTRIBUTION FOR FIG.1
Node ID sub-tabls on the node
Node1 Ta1 Ta2 Tb1 Tb2
Node2 Ta1 Ta2 Tb3 Tb4
Node3 Ta3 Ta4 Tb1 Tb2
Node4 Ta3 Ta4 Tb3 Tb4
close to 1 and NumNode is 100, then the network traffic of
our solution can reduce 80% than traditional solution.
III. A
LGORITHM
In this section, we will describe how to distribute the sub-
tables in the cluster. We regard the computing capacity of
TableA cross join TableB as a rectangle, whose length and
width are the number of sub-tables of the two tables. The
computation that a node can complete can be regarded as a
cover on the rectangle. We begin with a simple example. We
then introduce the details and optimizations of the algorithm.
A. Example
Consider the cross join between TableA and TableB in the
cluster consists of four nodes, where TableA and TableB have
four sub-tables respectively. Each sub-table has a unique name,
for example Ta1, Tb4. Each node has also a unique name, for
example Node2. Then the rectangle consists of 16 grid cells as
illustrated in Fig 1. Each cell represents a cross join between
two sub-tables of Tai and Tbj. When a cross join of two sub-
tables can be completed on a node, the cell can be covered by
the node, for example the cell of sub-tables of Ta1 and Tb1 is
covered by Node1.
The coverage solution shown in the Fig 1 is one of the
optimal solutions whose data distribution is illustrated in the
following table. The four nodes have the same computing
capacity and the network traffic is minimal. We can see that,
when all the nodes completes its computation, the cross join
of the two tables can be completed.
B. Algorithm Description
In the following, we introduce the approach to construct the
coverage solution on the rectangle of NumTa*NumTb using
NumNode nodes.The pseudo-code of approach is illustrated in
Algorithm 2. First, we estimate the replications of two tables,
and the replications means the average sub-tables of the two
tables on a node. Basically, we should ensure the computation
balance among the cluster,where each node should complete
at least the computing capacity of NumTa* NumTb/NumNode.
In order to reduce the network traffic, the number of sub-tables
of TableA and TableB should be similar. So we can estimate
the replications of TableA and TableB using the following
expressions:
Repa =
(NumT a ∗ NumT b/NumNode)
∗ NumNode/NumT a
=
(NumNode ∗ NumT b/NumT a)
Repb =
(NumT a ∗ NumT b/NumNode)
∗ NumNode/NumT b
=
(NumNode ∗ NumT a/NumT b)
Second, we construct the coverage solution using the repli-
cations. However, Repa and Repb are usually not integers, so
they can not used to divide the rectangle directly. We divide the
rectangle into two sub-rectangles, and on each sub-rectangle
we use different replications. Through an appropriate division,
we make that the average replications are similar to Repa and
Repb. The division of the rectangles is constructed using the
following expressions:
Xa1=Int(Repa) (1)
Xa2=Xa1+1 (2)
Xa1 ∗ Xb1+Xa2 ∗ Xb2=NumNode (3)
Xb1+Xb2=Repb (4)
where Xa1 and Xb1 are used to divide the first sub-rectangle
and Xa2 and Xb2 are used to divide the second sub-rectangle.
Only one of the last two expressions will be valid, which is
decided by the NumNode. As illustrated in Algorithm 1, if
NumNode is smaller than middle, then the former expression
is valid, otherwise the later is valid. Through these expres-
sions, we can compute the coverage solution of the two sub-
rectangles.
106
Authorized licensed use limited to: ZTE CORPORATION. Downloaded on July 18,2023 at 08:12:19 UTC from IEEE Xplore. Restrictions apply.
of 5
免费下载
【版权声明】本文为墨天轮用户原创内容,转载时必须标注文档的来源(墨天轮),文档链接,文档作者等基本信息,否则作者和墨天轮有权追究责任。如果您发现墨天轮中有涉嫌抄袭或者侵权的内容,欢迎发送邮件至:contact@modb.pro进行举报,并提供相关证据,一经查实,墨天轮将立刻删除相关内容。
下载排行榜

评论