trace vs pprof
go tool trace 和go tool pprof 两个工具的使用方法类似,但是两者的原理和侧重点不同:
1,go tool trace 更侧重于记录分析采样时间内运行时系统具体干了什么。原理是监听golang 调度器的事件,记录操作耗时等相关信息。Tracer为每个event打的时间戳都精确到纳秒(nanosecond)级精度。性能损耗大。
与goroutine调度有关的事件信息:goroutine的创建、启动和结束;goroutine在同步原语(包括mutex、channel收发操作)上的阻塞与解锁。
与网络有关的事件:goroutine在网络I/O上的阻塞和解锁;
与系统调用有关的事件:goroutine进入系统调用与从系统调用返回;
与垃圾回收器有关的事件:GC的开始/停止,并发标记、清扫的开始/停止。
2,go tool pprof 便是一个基于采样(sampling)的性能剖析(profiing)辅助工具。它基于定时器对运行的go程序进行各种采样,包括诸如CPU时间、内存分配等方面。
在Go运行时内部,CPU分析使用操作系统计时器来定期(每秒约100次,即10ms一次)中断执行。在每个中断(也称为样本)上,它同时收集当时的调用堆栈。当为了实现更高频度采样时(比如微秒级别的采样),目前的go profile无法支持(为此uber工程师提了一个名为pprof++的高精度、更精确并支持硬件监控的提案)。
trace性能差;pprof采样粒度太大,基于统计意义上的分析,能够定位到热点函数,但是缺少上下文信息,如果想让pprof带上上下文信息,pprof label就诞生了
pprof label
https://rakyll.org/profiler-labels/
可以给我们的pprof加上上下文信息,帮助定位同一个函数在不同调用场景下,看看具体哪个场景会出现热点。使用也非常简单
labels := pprof.Labels("worker", "purge")pprof.Do(ctx, labels, func(ctx context.Context) {// Do some work...go update(ctx) propagates labels in ctx.})复制
func Do(ctx context.Context, labels LabelSet, f func(context.Context))复制
在调用f时,将给定的标签添加到父上下文的标签映射中。在执行f时产生的Goroutine将继承增强的标签集。标签中的每一个键/值对都会按照给定的顺序插入到标签图中,并覆盖之前相同键的任何值。增强的标签图将在调用f的期间被设置,并在f返回后恢复。
需要注意的是定义Labels的时候一定要传偶数个label否则会panic
//panic: uneven number of arguments to pprof.Labels复制
func ForLabels(ctx context.Context, f func(key, value string) bool)复制
ForLabels对上下文上设置的每个标签调用f。函数f应该返回true来继续迭代,或者返回false来提前停止迭代。复制
func Label(ctx context.Context, key string) (string, bool)复制
Label 返回ctx上带有给定键的标签的值,以及一个表示该标签是否存在的布尔值。复制
func SetGoroutineLabels(ctx context.Context)复制
SetGoroutineLabels 设置当前goroutine的标签以匹配ctx。新的goroutine会继承创建它的goroutine的标签。这是一个比Do更低级的API,在可能的情况下应该使用Do。
具体使用
package mainimport ("context""fmt""log""os""runtime/pprof""strings""github.com/google/uuid")func main() {// Setup CPU profiling.f, err := os.Create("cpu.prof")if err != nil {log.Fatal("could not create CPU profile: ", err)}defer f.Close() // error handling omitted for exampleif err := pprof.StartCPUProfile(f); err != nil {log.Fatal("could not start CPU profile: ", err)}defer pprof.StopCPUProfile()ctx := context.Background()uuidWithHyphen := uuid.New()uuid := strings.Replace(uuidWithHyphen.String(), "-", "", -1)// Run workload for tenant1iteratePerTenant(ctx, "tenant1", uuid)// Run workload for tenant2iteratePerTenant(ctx, "tenant2", uuidWithHyphen.String())}var (iterationsPerTenant = map[string]int{"tenant1": 10_000_000_000,"tenant2": 1_000_000_000,})func iteratePerTenant(ctx context.Context, tenant, uuid string) {pprof.Do(ctx, pprof.Labels("tenant", tenant, "uuid", uuid), func(ctx context.Context) {iterate(iterationsPerTenant[tenant])})}func iterate(iterations int) {for i := 0; i < iterations; i++ {}}复制
执行
go run main.gogo tool pprof -http=:8080 cpu.profhttp://127.0.0.1:8000/debug/pprof/allocs?debug=1复制
可以看到下面的结果
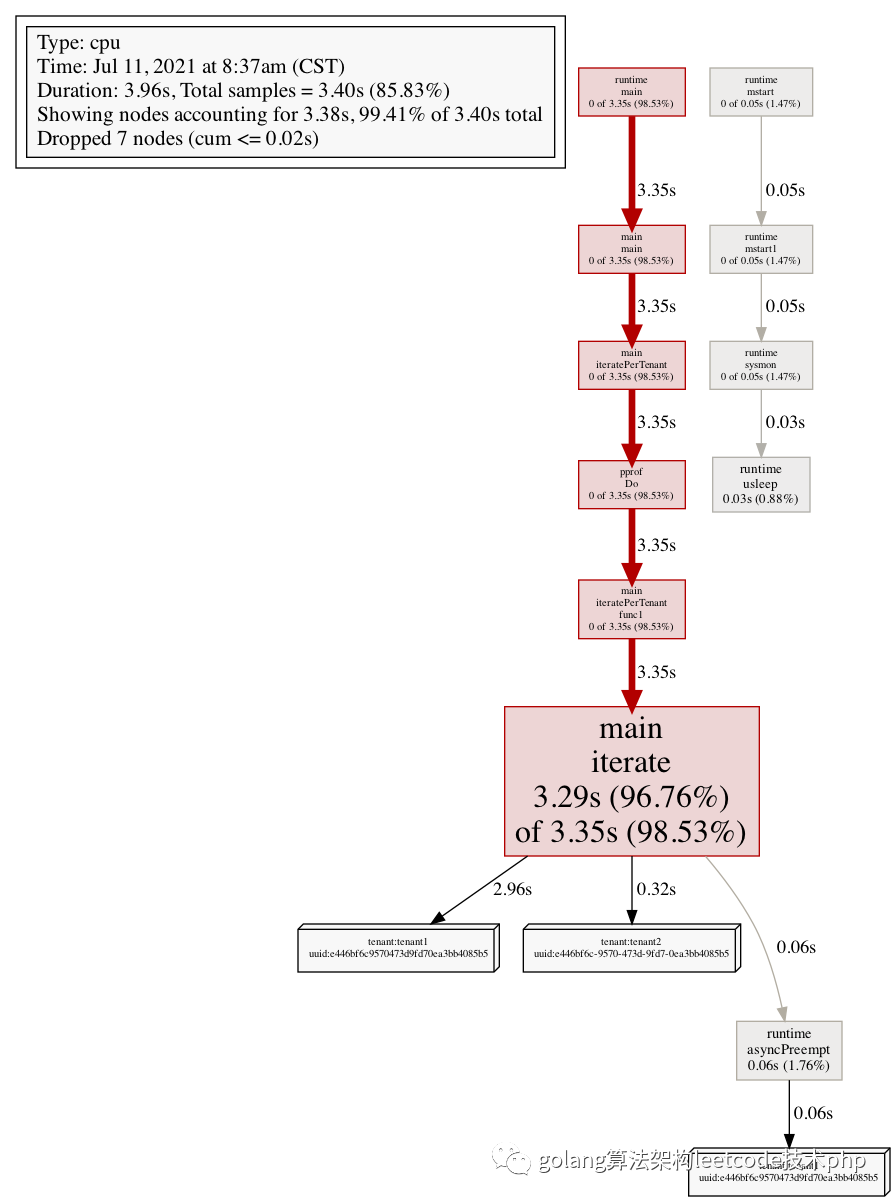
可以看到,整体的耗时中,区分了每一个不同guid的耗时(对应了立体框)
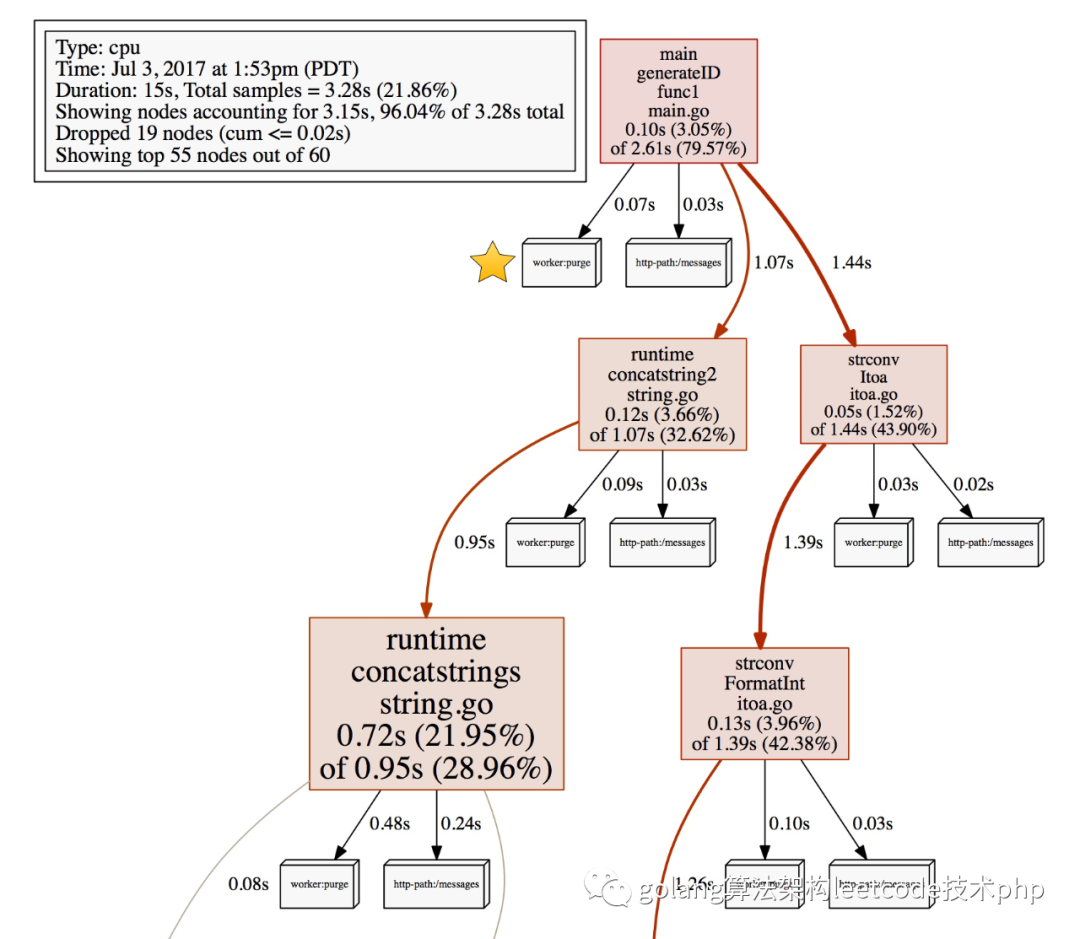
当然也可以配合bentch mark来做
func Add(str string) string {data := []byte(str)sData := string(data)datas = append(datas, sData)return sData}复制
针对上面的函数,加label之前
package mainimport "testing"const url = "Hello World!"func TestAdd(t *testing.T) {s := Add(url)if s == "" {t.Errorf("Test.Add error!")}}func BenchmarkAdd(b *testing.B) {for i := 0; i < b.N; i++ {Add(url)}}复制
运行
go test -bench=. -cpuprofile=cpu.profgo tool pprof -http=:8080 cpu.prof复制
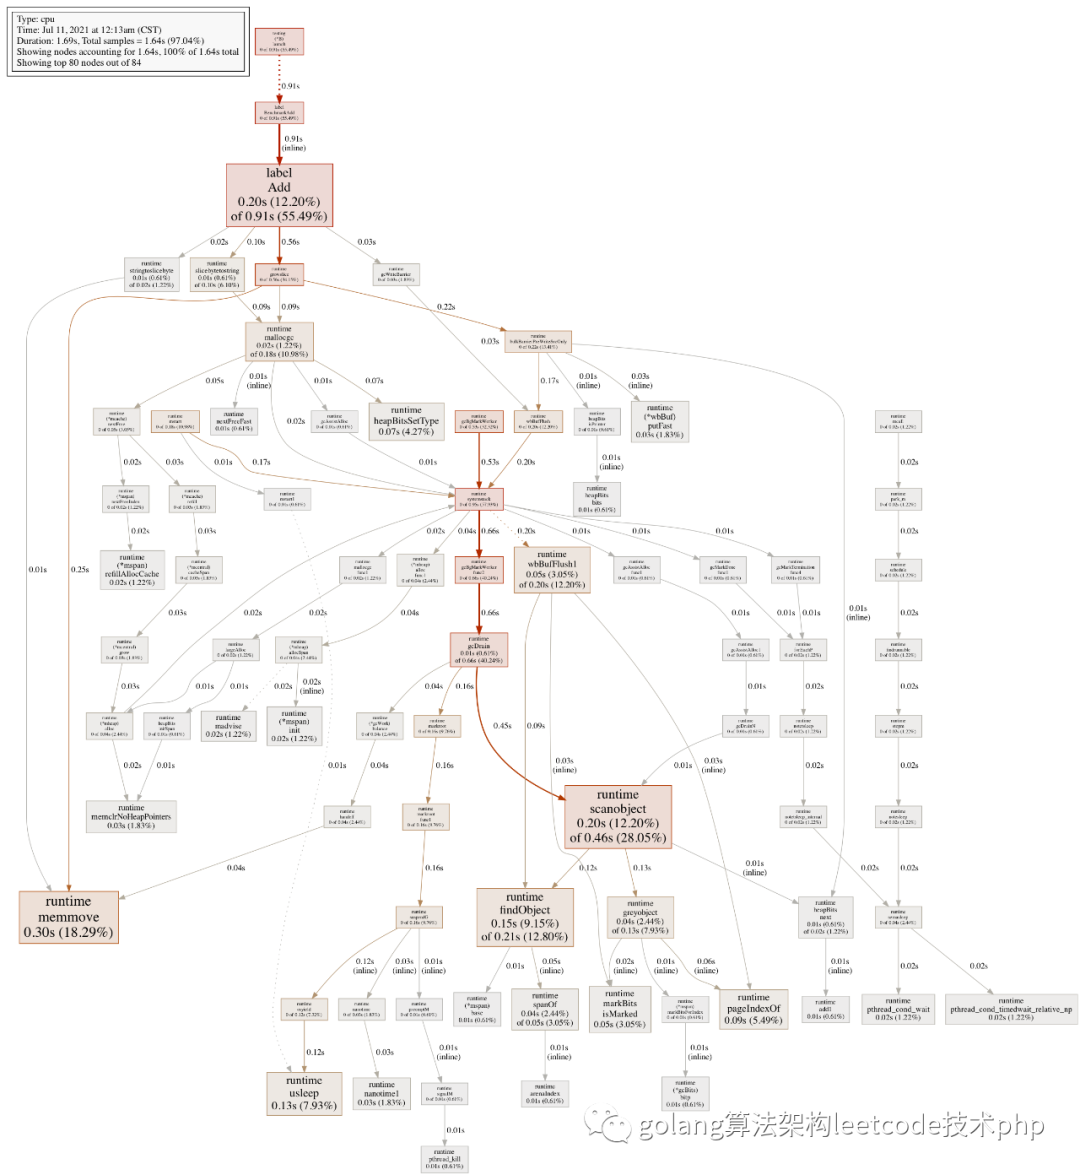
加label
package mainimport ("context""fmt""runtime/pprof""testing")const url = "Hello World!"func TestAdd(t *testing.T) {s := Add(context.Background(), url)if s == "" {t.Errorf("Test.Add error!")}}func BenchmarkAdd(b *testing.B) {ctx := context.Background()for i := 0; i < b.N; i++ {labels := pprof.Labels("worker", "purge", "number", fmt.Sprint(i%10))pprof.Do(ctx, labels, func(ctx context.Context) {Add(ctx, url)})}}复制
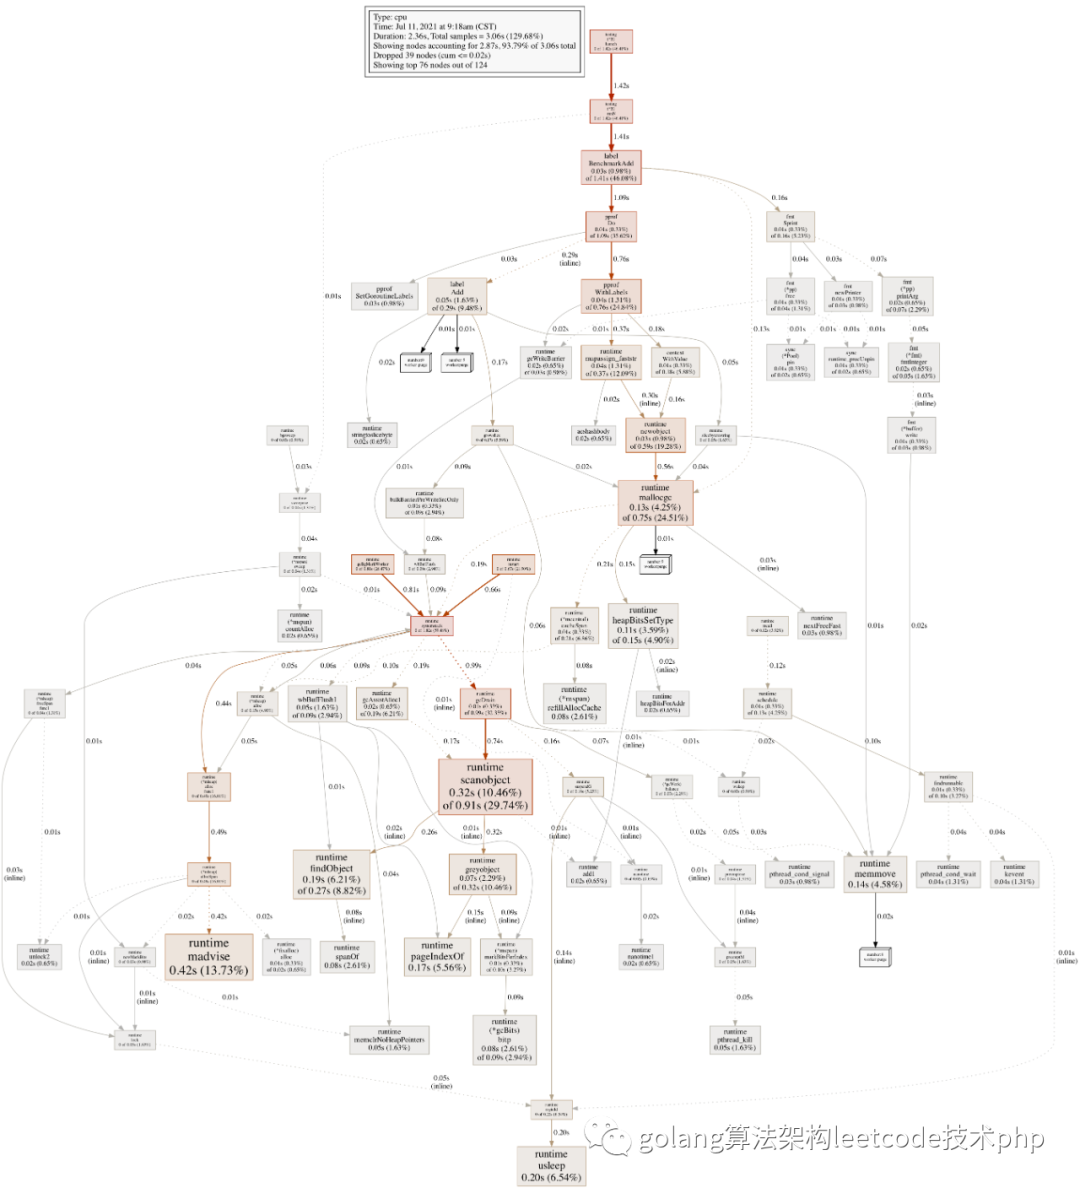
我们可以通过pprof label 做更细粒度的分析,方便我们能更 具体的定位热点,label的数据可以根据业务场景自己决定,比如traceId,比如请求url等等。