


之前做过 PostgreSQL基准测试工具benchmarksql和pgbench 的测试,今天测试下 SysBench,此工具专注于 OLTP 基准测试。
SysBench 的简单介绍
SysBench is a scriptable multi-threaded benchmark tool based on LuaJIT. It is most frequently used for database benchmarks, but can also be used to create arbitrarily complex workloads that do not involve a database server.
sysbench comes with the following bundled benchmarks:
oltp_*.lua: a collection of OLTP-like database benchmarksfileio: a filesystem-level benchmarkcpu: a simple CPU benchmarkmemory: a memory access benchmarkthreads: a thread-based scheduler benchmarkmutex: a POSIX mutex benchmark
SysBench 在 MySQL 生态系统中已经存在很长时间了,它最初由 Peter Zaitsev 于 2004 年编写,它的目的是提供一个工具来运行 MySQL 及其运行的硬件的综合基准测试,它不仅可以运行 CPU、内存和 I/O 测试,还可以选择在 MySQL 数据库上执行 OLTP 工作负载,OLTP 代表在线交易处理,是电子商务、订单输入或金融交易系统等在线应用程序的典型工作负载。
SysBench 最初是由 Peter Zaitsev 于 2004 年首次开发,不久之后,Alexey Kopytov 接管了它的开发,达到了 0.4.12 版本开发停止了,经过长时间的休息,Alexey 于 2016 年再次开始在 SysBench 上进行开发,很快 0.5 版已经发布,OLTP 基准测试被重写为使用基于 LUA 的脚本,然后,在 2017 年,发布了 SysBench 1.0。与旧的 0.4.12 版本相比,这就像白天和黑夜,1.0版本以后可以使用 LUA 自定义基准测试,而不是硬编码脚本。
Linux环境源码编译安装
源码包Github下载地址:https://github.com/akopytov/sysbench,目前最新的版本是 1.0.20。
[root@pgtest3 ~]# mkdir /enmo/app/sysbench-1.0.20
[root@pgtest3 ~]# ln -s /enmo/app/sysbench-1.0.20 /enmo/app/sysbench
[root@pgtest3 ~]# cd /enmo/soft/
[root@pgtest3 soft]# tar -zxvf sysbench-1.0.20.tar.gz
[root@pgtest3 soft]# cd sysbench-1.0.20
[root@pgtest3 sysbench-1.0.20]# ./autogen.sh
# 查看configure的帮助信息,根据需要选择参数
[root@pgtest3 sysbench-1.0.20]# ./configure --help
# 因本次测试是针对PostgreSQl,所以选用以下参数进行编译安装
# 但是configure默认执行MYSQL,所以需要使用--without-mysql参数取消对MYSQL的支持,不然安装的时候会报 mysql_config executable not found
[root@pgtest3 sysbench-1.0.20]# ./configure --prefix=/enmo/app/sysbench --without-mysql --with-pgsql --with-pgsql-includes=/enmo/app/pgsql/13.3/include --with-pgsql-libs=/enmo/app/pgsql/13.3/lib
[root@pgtest3 sysbench-1.0.20]# make -j
[root@pgtest3 sysbench-1.0.20]# make install
复制
SysBench 的参数
| 参数 | 解释 |
|---|---|
| 通用参数 | - |
| –threads=N | 要使用的线程数,模拟不同并发,默认[1]。 |
| –events=N | 事件总数限制,与–time参数二选一,默认[0]。 |
| –time=N | 以秒(s)为单位的总执行时间限制,与–events参数二选一,默认[10]。 |
| –forced-shutdown=STRING | 在–time限制后 强制关闭之前 等待的秒数或off(禁用),默认[off]。 |
| –thread-stack-size=SIZE | 每个线程的stack大小,默认[64K]。 |
| –rate=N | 平均事务率(tps),0为不限速,默认值[0]。 |
| –report-interval=N | 以指定的时间间隔(以秒为单位)定期报告中间统计信息,0表示禁用中间报告,默认[0]。 |
| –report-checkpoints | 转储完整的统计数据,并在指定的时间点重置所有计数器。 |
| –validate | 在可能的情况下执行验证检查,默认[off]。 |
| –config-file | 包含命令行选项的文件。 |
| 随机数生成器参数 | - |
| –rand-type=STRING | 随机的模式:uniform(固定),gaussian(高斯),special(特定),pareto(帕雷特),默认[special]。 |
| –rand-spec-iter=N | 用于数字生成的迭代次数,默认[12] |
| –rand-spec-pct=N | 对于special随机模式中待处理值的百分比,默认[1] |
| –rand-spec-res=N | 对于special随机模式中指定值的比例,默认[75]。 |
| –rand-seed=N | 随机数生成依据,0表示按当前时间为基础生成随机数,默认[0] |
| –rand-pareto-h=N | pareto分布,默认[0.2] |
| 日志参数 | - |
| –verbosity=N | 日志级别,{5 - debug, 0 - only critical messages} 默认[3]。 |
| –percentile=N | 查询相应时间采样的百分比,0禁用,默认值为95%。 |
| –histogram[=on/off] | 在报告中打印延迟直方图,默认[off] |
| 数据库通用参数 | - |
| –db-driver=STRING | 指定要使用的数据库驱动程序(‘help’ 获取可用驱动程序列表) |
| –db-ps-mode=STRING | SQL是否需要预编译,模式有:auto/disable,默认[auto]。 |
| PostgreSQL 参数 | - |
| –pgsql-host=STRING | PostgreSQL 服务器主机,默认[localhost] |
| –pgsql-port=N | PostgreSQL 服务器端口,默认[5432] |
| –pgsql-user=STRING | PostgreSQL 用户,默认[sbtest] |
| –pgsql-password=STRING | PostgreSQL 密码,默认[] |
| –pgsql-db=STRING | PostgreSQL 数据库名称,默认[sbtest] |
SysBench 1.0 自带的基准测试
[root@pgtest3 sysbench]# pwd
/enmo/app/sysbench/share/sysbench
[root@pgtest3 sysbench]# ll
total 60
-rwxr-xr-x 1 root root  1452 Nov 18 12:00 bulk_insert.lua            # 测试执行多行插入的能力
-rw-r--r-- 1 root root 14369 Nov 18 12:00 oltp_common.lua
-rwxr-xr-x 1 root root  1290 Nov 18 12:00 oltp_delete.lua            # 只delete
-rwxr-xr-x 1 root root  2415 Nov 18 12:00 oltp_insert.lua            # 只insert
-rwxr-xr-x 1 root root  1265 Nov 18 12:00 oltp_point_select.lua      # 基于主键的select
-rwxr-xr-x 1 root root  1649 Nov 18 12:00 oltp_read_only.lua         # 只读
-rwxr-xr-x 1 root root  1824 Nov 18 12:00 oltp_read_write.lua        # 读写
-rwxr-xr-x 1 root root  1118 Nov 18 12:00 oltp_update_index.lua      # 基于索引的update
-rwxr-xr-x 1 root root  1127 Nov 18 12:00 oltp_update_non_index.lua  # 非基于索引的update
-rwxr-xr-x 1 root root  1440 Nov 18 12:00 oltp_write_only.lua        # 只写(DELETE、INSERT 和 UPDATE 的混合)
-rwxr-xr-x 1 root root  1919 Nov 18 12:00 select_random_points.lua   # 使用 IN() 列表中的随机点运行一些随机select
-rwxr-xr-x 1 root root  2118 Nov 18 12:00 select_random_ranges.lua   # 使用 BETWEEN 的随机范围运行一些随机select
drwxr-xr-x 4 root root    49 Nov 18 12:00 tests
复制
同样,每个基准测试都有其自己的配置
[root@pgtest3 sysbench]# /enmo/app/sysbench/bin/sysbench ./oltp_read_write.lua help
sysbench 1.0.20 (using bundled LuaJIT 2.1.0-beta2)

oltp_read_write.lua options:
  --auto_inc[=on|off]           Use AUTO_INCREMENT column as Primary Key (for MySQL), or its alternatives in other DBMS. When disabled, use client-generated IDs [on]
  --create_secondary[=on|off]   Create a secondary index in addition to the PRIMARY KEY [on]
  --delete_inserts=N            Number of DELETE/INSERT combinations per transaction [1]
  --distinct_ranges=N           Number of SELECT DISTINCT queries per transaction [1]
  --index_updates=N             Number of UPDATE index queries per transaction [1]
  --mysql_storage_engine=STRING Storage engine, if MySQL is used [innodb]
  --non_index_updates=N         Number of UPDATE non-index queries per transaction [1]
  --order_ranges=N              Number of SELECT ORDER BY queries per transaction [1]
  --pgsql_variant=STRING        Use this PostgreSQL variant when running with the PostgreSQL driver. The only currently supported variant is 'redshift'. When enabled, create_secondary is automatically disabled, and delete_inserts is set to 0
  --point_selects=N             Number of point SELECT queries per transaction [10]
  --range_selects[=on|off]      Enable/disable all range SELECT queries [on]
  --range_size=N                Range size for range SELECT queries [100]
  --secondary[=on|off]          Use a secondary index in place of the PRIMARY KEY [off]
  --simple_ranges=N             Number of simple range SELECT queries per transaction [1]
  --skip_trx[=on|off]           Don't start explicit transactions and execute all queries in the AUTOCOMMIT mode [off]
  --sum_ranges=N                Number of SELECT SUM() queries per transaction [1]
  --table_size=N                Number of rows per table [10000]
  --tables=N                    Number of tables [1]
复制
使用 SysBench 对 PostgreSQL 进行 OLTP 只读的基准测试
测试环境沿用我之前写的 PostgreSQL高可用测试系列之Patroni + etcd + HAProxy + Keepalived 离线部署
192.168.58.10 是主节点,192.168.58.11/12 是从节点,192.168.58.20是VIP,5000端口提供读写服务,5001端口提供只读服务。
[root@pgtest3 sysbench]# patronictl list
+---------+---------------+---------+---------+----+-----------+
| Member  | Host          | Role    | State   | TL | Lag in MB |
+ Cluster: pg_cluster (7025023477017500881) --+----+-----------+
| pgtest1 | 192.168.58.10 | Leader  | running | 31 |           |
| pgtest2 | 192.168.58.11 | Replica | running | 31 |         0 |
| pgtest3 | 192.168.58.12 | Replica | running | 31 |         0 |
+---------+---------------+---------+---------+----+-----------+
复制
测试之前需要先创建一个数据集,100万行将产生约 240 MB 的数据,创建 10 张表,大约 2.4GB:
# 准备个简单的脚本,便于后面执行命令
[root@pgtest3 ~]# cat sysbench.sh
/enmo/app/sysbench/bin/sysbench /enmo/app/sysbench/share/sysbench/$1 \
--db-driver=pgsql --pgsql-host=$2 --pgsql-port=$3 --pgsql-user=postgres --pgsql-password=postgres --pgsql-db=sysbench \
--tables=10 --table-size=1000000 $4 $5

# 创建数据库
[root@pgtest1 ~]# createdb sysbench
# prepare 初始化数据集
[root@pgtest3 ~]# sh sysbench.sh oltp_read_only.lua 192.168.58.20 5000 '--threads=4' prepare
# 数据库中 \l+ 可以看到数据库大小为 2434 MB
复制
下面测试仅主键查询,禁用所有其他类型的 SELECT,禁用 prepared statements,因为我们要测试常规查询,4个并发基准测试运行 100 秒,不限制查询速率,将报告间隔设置为2秒
# sh sysbench.sh oltp_read_only.lua 192.168.58.20 5001 '--threads=4 --time=300 --range_selects=off --db-ps-mode=disable --report-interval=2' run
复制
下面是我在虚拟机上的测试数据
| threads | 负载均衡(20+5001) | 单节点从库(11+5432) | ||
|---|---|---|---|---|
| 4 | tps: 470.57 | qps: 5646.81 | tps: 720.89 | qps: 8650.67 |
| 16 | tps: 1364.81 | qps: 16377.67 | tps: 1491.00 | qps: 17892.03 |
| 32 | tps: 1481.46 | qps: 17777.55 | tps: 1387.42 | qps: 16649.01 |
| 64 | tps: 1508.26 | qps: 18099.17 | tps: 1334.54 | qps: 16014.43 |
并发为4的时候,虚拟机的CPU跑不满,使用50%左右。

并发为32的时候,虚拟机的CPU也跑不满。
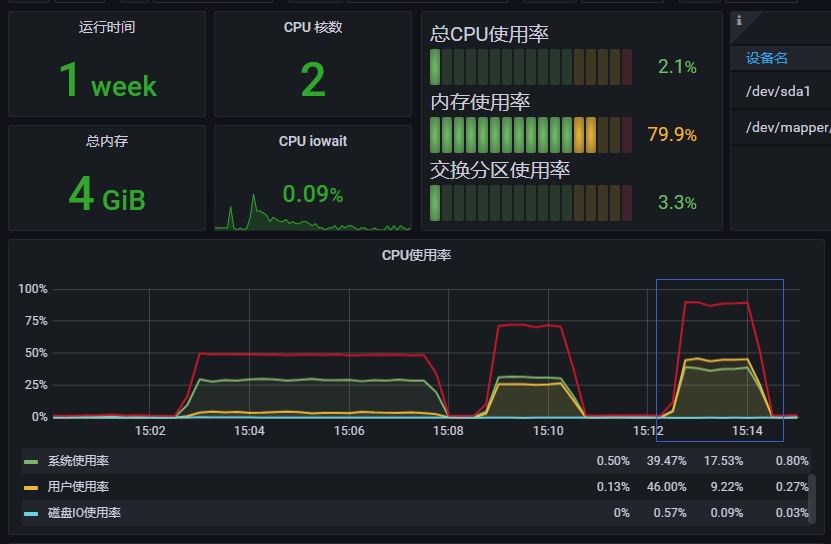
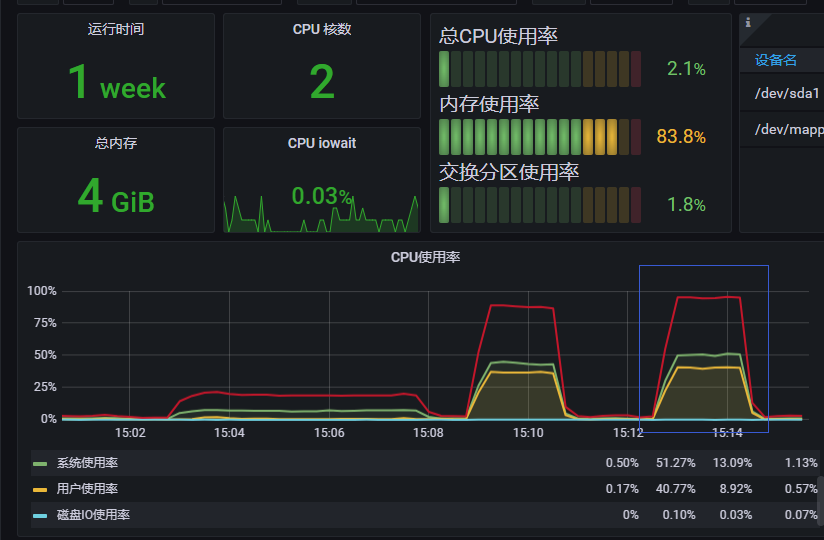
但是并发为32的时候,直连从库的测试跑满了,到达了顶峰
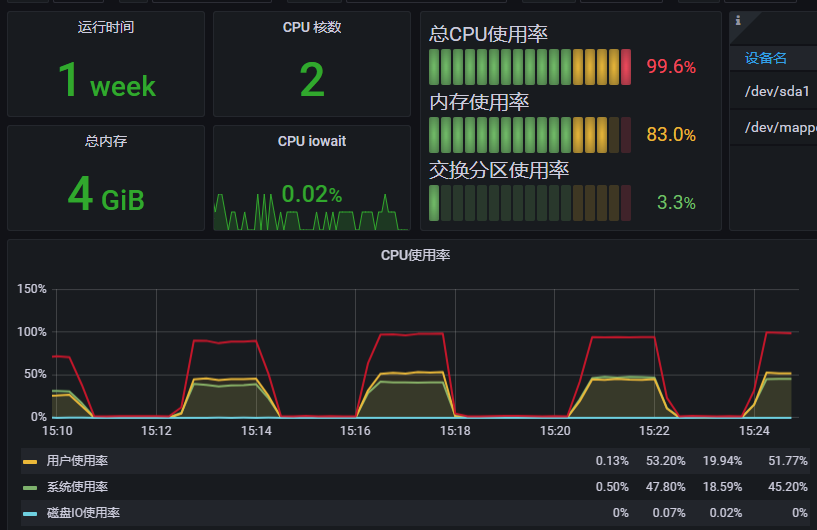
由此可见,个人观点:在低并发的时候,只读库负载均衡的效率并不是那么好(1 + 1) < 1,在高并发的时候,应该能体现出只读库负载均衡的价值(1 + 1) > 1。
以下是部分测试生成的报告:
# sh sysbench.sh oltp_read_only.lua 192.168.58.20 5001 '--threads=64 --time=100 --range_selects=off --db-ps-mode=disable --report-interval=2' run

SQL statistics:
    queries performed:
        read:                            1511610
        write:                           0
        other:                           302322
        total:                           1813932
    transactions:                        151161 (1508.26 per sec.)
    queries:                             1813932 (18099.17 per sec.)
    ignored errors:                      0      (0.00 per sec.)
    reconnects:                          0      (0.00 per sec.)

General statistics:
    total time:                          100.2206s
    total number of events:              151161

Latency (ms):
         min:                                    5.98
         avg:                                   42.37
         max:                                  751.02
         95th percentile:                      121.08
         sum:                              6404137.09

Threads fairness:
    events (avg/stddev):           2361.8906/640.85
    execution time (avg/stddev):   100.0646/0.06
复制
在此处找到有关已执行查询和其他 (BEGIN/COMMIT) 语句的信息,能了解执行了多少事务、发生了多少错误、吞吐量和总耗时间是多少,还可以检查延迟指标和跨线程的查询分布。
如果我们对延迟分布感兴趣,还可以将“–histogram”参数传递给 SysBench。这会产生一个额外的输出,如下所示:
Latency histogram (values are in milliseconds)
       value  ------------- distribution ------------- count
      34.330 |******                                   805
      34.954 |**********                               1187
      35.589 |*************                            1578
      36.236 |*****************                        2143
      36.894 |*********************                    2671
      37.565 |**************************               3203
      38.247 |******************************           3750
      38.942 |**********************************       4281
      39.650 |*************************************    4659
      40.370 |**************************************   4704
      41.104 |***************************************  4833
      41.851 |*************************************    4643
      42.611 |************************************     4456
      43.385 |**********************************       4216
      44.173 |*******************************          3824
      44.976 |******************************           3715
      45.793 |*****************************            3673
      46.625 |******************************           3760
      47.472 |********************************         3979
      48.335 |**********************************       4244
      49.213 |************************************     4444
      50.107 |**************************************   4784
      51.018 |***************************************  4915
      51.945 |**************************************** 4979
      52.889 |**************************************** 4984
      53.850 |**************************************   4706
      54.828 |************************************     4431
      55.824 |*********************************        4088
      56.839 |*****************************            3558
      57.871 |*************************                3173
      58.923 |*********************                    2649
      59.993 |******************                       2221
      61.083 |***************                          1915
      62.193 |************                             1553
      63.323 |**********                               1307
      64.474 |********                                 1041
      65.645 |*******                                  839
复制
测试完成后可以使用cleanup清理数据:
[root@pgtest3 ~]# sh sysbench.sh oltp_read_only.lua 192.168.58.20 5000 cleanup
sysbench 1.0.20 (using bundled LuaJIT 2.1.0-beta2)

Dropping table 'sbtest1'...
Dropping table 'sbtest2'...
Dropping table 'sbtest3'...
Dropping table 'sbtest4'...
Dropping table 'sbtest5'...
Dropping table 'sbtest6'...
Dropping table 'sbtest7'...
Dropping table 'sbtest8'...
Dropping table 'sbtest9'...
Dropping table 'sbtest10'...
复制
使用 SysBench 对 PostgreSQL 进行 OLTP 读写的基准测试
准备数据
[root@pgtest3 ~]# sh sysbench.sh oltp_read_write.lua 192.168.58.20 5000 '--threads=4' prepare
复制
完成后,我们可以调整默认值以强制更多写入查询组合:
[root@pgtest3 ~]# sh sysbench.sh oltp_read_write.lua 192.168.58.20 5000 '--threads=8 --time=100 --delete_inserts=10 --index_updates=10 --non_index_updates=10 --db-ps-mode=disable --report-interval=2' run
复制
下面是我在虚拟机上的测试数据
| threads | VIP(20+5000) | 直连主库(10+5432) | ||
|---|---|---|---|---|
| 8 | tps: 127.58 | qps: 7149.40 | tps: 150.17 | qps: 8416.12 |
| 16 | tps: 136.87 | qps: 7677.73 | tps: 153.79 | qps: 8624.71 |
| 32 | tps: 147.43 | qps: 8295.99 | tps: 144.20 | qps: 8109.54 |
| 64 | tps: 147.54 | qps: 8319.96 | tps: 139.70 | qps: 7895.86 |
由此可见,个人观点:在低并发的时候,HAProxy + Keepalived 提供的VIP和端口视乎存在一定的性能损耗,在高并发的时候,HAProxy + Keepalived 比较稳定,而直连库的性能逐渐下降。
--------------end
评论

 0 点赞
0 点赞


