


前言
prometheus生态系统由多个组件组成,其中许多组件是可选的。
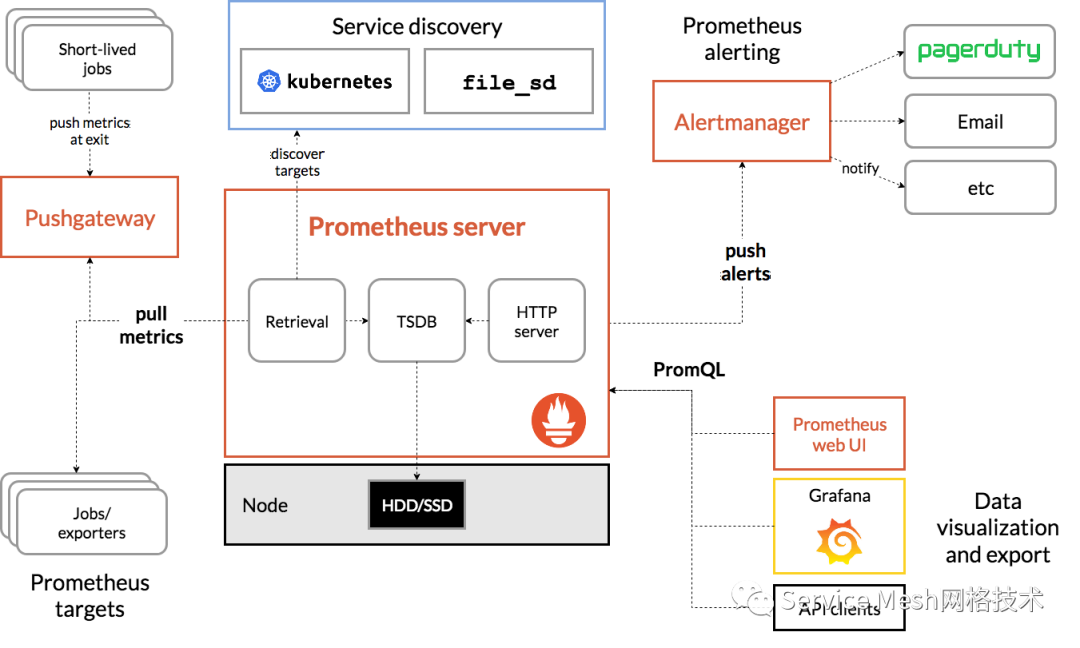
promethues server:主要获取和存储时间序列数据
exporters:主要是作为agent收集数据发送到prometheus server,不同的数据收集由不同的exporters实现,如监控主机有node-exporters,mysql有MySQL server exporters等
pushgateway:允许短暂和批处理的jobs推送它们的数据到prometheus;由于这类工作的存在时间不够长,所以需要他们主动将数据推送到pushgateway,然后由pushgateway将数据发送的prometheus。
alertmanager:实现prometheus的告警功能。
Prometheus架构:
一、监控主机是否存活
alert: 主机状态expr: up == 0for: 1mlabels:status: 非常严重annotations:summary: "{{$labels.instance}}:服务器宕机"description: "{{$labels.instance}}:服务器延时超过5分钟"复制
二、监控服务应用是否挂掉
alert: serverDownexpr: up{job="acs-ms"} == 0for: 1mlabels:severity: criticalannotations:description: 实例:{{ $labels.instance }} 宕机了summary: Instance {{ $labels.instance }} down复制
三、监控接口异常发生情况
alert: interface_request_exceptionexpr: increase(http_server_requests_seconds_count{exception!="None",exception!="ServiceException",job="acs-ms"}[1m])> 0for: 1slabels:severity: pageannotations:description: '实例:{{ $labels.instance }}的{{$labels.uri}}的接口发生了{{ $labels.exception}}异常 'summary: 监控一定时间内接口请求异常的数量复制
注:exception!=“ServiceException” 是将一些手动抛出的自定义异常给排除掉。
四、监控接口请求时长
alert: interface_request_durationexpr: increase(http_server_requests_seconds_sum{exception="None",job="acs-ms",uri!~".*Excel.*"}[1m])/ increase(http_server_requests_seconds_count{exception="None",job="acs-ms",uri!~".*Excel.*"}[1m])> 5for: 5slabels:severity: pageannotations:description: '实例:{{ $labels.instance }} 的{{$labels.uri}}接口请求时长超过了设置的阈值:5s,当前值{{$value }}s 'summary: 监控一定时间内的接口请求时长复制
注: uri!~".Excel." 是将一些接口给排除掉。这个是将包含Excel的接口排除掉。
五、监控系统CPU使用百分比
alert: CPUTooHeightexpr: process_cpu_usage{job="acs-ms"} > 0.3for: 15slabels:severity: pageannotations:description: '实例:{{ $labels.instance }} 的cpu超过了设置的阈值:30%,当前值{{ $value }} 'summary: 监测系统CPU使用的百分比复制
六、监控tomcat活动线程占总线程的比例
alert: tomcat_thread_heightexpr: tomcat_threads_busy_threads{job="acs-ms"}/ tomcat_threads_config_max_threads{job="acs-ms"} > 0.5for: 15slabels:severity: pageannotations:description: '实例:{{ $labels.instance }} 的tomcat活动线程占总线程的比例超过了设置的阈值:50%,当前值{{ $value}} 'summary: 监控tomcat活动线程占总线程的比例统内存使用情况复制
七、监控系统内存使用情况
alert: 内存使用expr: round(100- node_memory_MemAvailablfor: 1mlabels:severity: warningannotations:summary: "内存使用率过高"description: "当前使用率{{ $value }}%"复制
八、监控系统IO使用情况
alert: IO性能expr: 100-(avg(irate(node_disk_io_time_seconds_total[1m])) by(instance)* 100) < 60for: 1mlabels:status: 严重告警annotations:summary: "{{$labels.mountpoint}} 流入磁盘IO使用率过高!"description: "{{$labels.mountpoint }} 流入磁盘IO大于60%(目前使用:{{$value}})"复制
九、监控tcp连接数使用情况
alert: TCP会话expr: node_netstat_Tcp_CurrEstab > 1000for: 1mlabels:status: 严重告警annotations:summary: "{{$labels.mountpoint}} TCP_ESTABLISHED过高!"description: "{{$labels.mountpoint }} TCP_ESTABLISHED大于1000%(目前使用:{{$value}}%)"复制
十、监控网络带宽使用情况
alert: 网络expr: ((sum(rate (node_network_receive_bytes_total{device!~'tap.*|veth.*|br.*|docker.*|virbr*|lo*'}[5m])) by (instance)) / 100) > 102400for: 1mlabels:status: 严重告警annotations:summary: "{{$labels.mountpoint}} 流入网络带宽过高!"description: "{{$labels.mountpoint }}流入网络带宽持续2分钟高于100M. RX带宽使用率{{$value}}"复制
十一、监控api接口访问延迟
alert: APIHighRequestLatencyexpr: api_http_request_latencies_second{quantile="0.5"} > 1for: 10mannotations:summary: "High request latency on {{ $labels.instance }}"description: "{{ $labels.instance }} has a median request latency above 1s (current value: {{ $value }}s)"复制
十二、监控JVM OLD GC耗时告警升级
# 在5分钟里,Old GC花费时间超过30%alert: old-gc-time-too-muchexpr: increase(jvm_gc_collection_seconds_sum{gc="PS MarkSweep"}[5m]) > 5 * 60 * 0.3for: 5mlabels:severity: yellowannotations:summary: "JVM Instance {{ $labels.instance }} Old GC time > 30% running time"description: "{{ $labels.instance }} of job {{ $labels.job }} has been in status [Old GC time > 30% running time] for more than 5 minutes. current seconds ({{ $value }}%)"# 在5分钟里,Old GC花费时间超过50%alert: old-gc-time-too-muchexpr: increase(jvm_gc_collection_seconds_sum{gc="PS MarkSweep"}[5m]) > 5 * 60 * 0.3for: 5mlabels:severity: orangeannotations:summary: "JVM Instance {{ $labels.instance }} Old GC time > 50% running time"description: "{{ $labels.instance }} of job {{ $labels.job }} has been in status [Old GC time > 50% running time] for more than 5 minutes. current seconds ({{ $value }}%)"# 在5分钟里,Old GC花费时间超过80%alert: old-gc-time-too-muchexpr: increase(jvm_gc_collection_seconds_sum{gc="PS MarkSweep"}[5m]) > 5 * 60 * 0.3for: 5mlabels:severity: redannotations:summary: "JVM Instance {{ $labels.instance }} Old GC time > 80% running time"description: "{{ $labels.instance }} of job {{ $labels.job }} has been in status [Old GC time > 80% running time] for more than 5 minutes. current seconds ({{ $value }}%)"复制
十三、监控磁盘使用率
alert: NodeFilesystemUsage-highexpr: (1- (node_filesystem_free_bytes{fstype=~"ext3|ext4|xfs"} / node_filesystem_size_bytes{fstype=~"ext3|ext4|xfs"}) ) * 100 > 80for: 2mlabels:severity: warningannotations:summary: "{{$labels.instance}}: High Node Filesystem usage detected"description: "{{$labels.instance}}: Node Filesystem usage is above 80% ,(current value is: {{ $value }})"复制
十四、监控mysql资源相关
alert: MySQL is downexpr: mysql_up == 0for: 1mlabels:severity: criticalannotations:summary: "Instance {{ $labels.instance }} MySQL is down"description: "MySQL database is down. This requires immediate action!"alert: Mysql_High_QPSexpr: rate(mysql_global_status_questions[5m]) > 500for: 2mlabels:severity: warningannotations:summary: "{{$labels.instance}}: Mysql_High_QPS detected"description: "{{$labels.instance}}: Mysql opreation is more than 500 per second ,(current value is: {{ $value }})"alert: Mysql_Too_Many_Connectionsexpr: rate(mysql_global_status_threads_connected[5m]) > 200for: 2mlabels:severity: warningannotations:summary: "{{$labels.instance}}: Mysql Too Many Connections detected"description: "{{$labels.instance}}: Mysql Connections is more than 100 per second ,(current value is: {{ $value }})"alert: Mysql_Too_Many_slow_queriesexpr: rate(mysql_global_status_slow_queries[5m]) > 3for: 2mlabels:severity: warningannotations:summary: "{{$labels.instance}}: Mysql_Too_Many_slow_queries detected"description: "{{$labels.instance}}: Mysql slow_queries is more than 3 per second ,(current value is: {{ $value }})"alert: SQL thread stoppedexpr: mysql_slave_status_slave_sql_running == 0for: 1mlabels:severity: criticalannotations:summary: "Instance {{ $labels.instance }} SQL thread stopped"description: "SQL thread has stopped. This is usually because it cannot apply a SQL statement received from the master."alert: Slave lagging behind Masterexpr: rate(mysql_slave_status_seconds_behind_master[5m]) >30for: 1mlabels:severity: warningannotations:summary: "Instance {{ $labels.instance }} Slave lagging behind Master"description: "Slave is lagging behind Master. Please check if Slave threads are running and if there are some performance issues!"复制
十五、监控Kubernetest资源相关
- alert: PodMemUsageexpr: container_memory_usage_bytes{container_name!=""} / container_spec_memory_limit_bytes{container_name!=""} *100 != +Inf > 80for: 2mlabels:severity: warningannotations:summary: "{{$labels.name}}: Pod High Mem usage detected"description: "{{$labels.name}}: Pod Mem is above 80% ,(current value is: {{ $value }})"- alert: PodCpuUsageexpr: sum by (pod_name)( rate(container_cpu_usage_seconds_total{image!=""}[1m] ) ) * 100 > 80for: 2mlabels:severity: warningannotations:summary: "{{$labels.name}}: Pod High CPU usage detected"description: "{{$labels.name}}: Pod CPU is above 80% ,(current value is: {{ $value }})"#探测node节点状态- alert: node-statusannotations:message: node-{{ $labels.hostname }}故障expr: |kube_node_status_condition{status="unknown",condition="Ready"} == 1for: 1mlabels:severity: warning最后保存退出再编辑alertmanager-secret.yaml文件,这个文件主要是配置发送邮件或是钉钉,我这里是钉钉方式告警,邮件也配置了,只是没有用到,邮件现在很少看,所以直接钉钉告警查看了,把以下内容替换掉原来,如下:apiVersion: v1- alert: JobDown #检测job的状态,持续5分钟metrices不能访问会发给altermanager进行报警expr: up == 0 #0不正常,1正常for: 5m #持续时间 , 表示持续5分钟获取不到信息,则触发报警labels:severity: errorcluster: k8sannotations:summary: "Job: {{ $labels.job }} down"description: "Instance:{{ $labels.instance }}, Job {{ $labels.job }} stop "- alert: PodDownexpr: kube_pod_container_status_running != 1for: 2slabels:severity: warningcluster: k8sannotations:summary: 'Container: {{ $labels.container }} down'description: 'Namespace: {{ $labels.namespace }}, Pod: {{ $labels.pod }} is not running'- alert: PodReadyexpr: kube_pod_container_status_ready != 1for: 5m #Ready持续5分钟,说明启动有问题labels:severity: warningcluster: k8sannotations:summary: 'Container: {{ $labels.container }} ready'description: 'Namespace: {{ $labels.namespace }}, Pod: {{ $labels.pod }} always ready for 5 minitue'- alert: PodRestartexpr: changes(kube_pod_container_status_restarts_total[30m])>0 #最近30分钟pod重启for: 2slabels:severity: warningcluster: k8sannotations:summary: 'Container: {{ $labels.container }} restart'description: 'namespace: {{ $labels.namespace }}, pod: {{ $labels.pod }} restart {{ $value }} times'
十六、微信、邮件通知模板
global:resolve_timeout: 5msmtp_smarthost: xxx.xxx.cn:587smtp_from: xxxx@xxx.cnsmtp_auth_username: xxx@xx.cnsmtp_auth_password: xxxxxxxx#告警模板templates:- '/usr/local/alertmanager/wechat.tmpl'route:#按alertname进行分组group_by: ['alertname']group_wait: 5m#同一组内警报,等待group_interval时间后,再继续等待repeat_interval时间group_interval: 5m#当group_interval时间到后,再等待repeat_interval时间后,才进行报警repeat_interval: 5m# 默认微信告警receiver: 'wechat'# 按部门rd、集群cluster、产品product区分,进行不同方式的告警routes:- receiver: 'email_rd'match_re:department: 'rd'- receiver: 'email_k8s'match_re:cluster: 'k8s'- receiver: 'wechat_product'match_re:product: 'app'receivers:#微信告警通道- name: 'wechat'wechat_configs:- corp_id: 'wwxxxxfdd372e'agent_id: '1000005'api_secret: 'FxLzx7sdfasdAhPgoK9Dt-NWYOLuy-RuX3I'to_user: 'test1|test2'send_resolved: true#邮件告警通道- name: 'email_tech'email_configs:- to: muxq@cityhouse.cnheaders: {"subject":'{{ template "email.test.header" . }}'}html: '{{ template "email.test.message" . }}'send_resolved: true- name: 'email_k8s'email_configs:- to: 'xxx@xx.cn,xx@xx.cn'headers: {"subject":'{{ template "email.test.header" . }}'}html: '{{ template "email.test.message" . }}'send_resolved: true#微信告警通道- name: 'wechat_product'wechat_configs:- corp_id: 'wwxxxxfdd372e'agent_id: '1000005'api_secret: 'FxLzx7sdfasdAhPgoK9Dt-NWYOLuy-RuX3I'to_user: 'test1|test2'send_resolved: true复制
总结
👇👇👇点击关注,更多内容持续更新...

文章转载自CloudNativeX,如果涉嫌侵权,请发送邮件至:contact@modb.pro进行举报,并提供相关证据,一经查实,墨天轮将立刻删除相关内容。
评论
相关阅读
2025年4月中国数据库流行度排行榜:OB高分复登顶,崖山稳驭撼十强
墨天轮编辑部
2310次阅读
2025-04-09 15:33:27
数据库国产化替代深化:DBA的机遇与挑战
代晓磊
1070次阅读
2025-04-27 16:53:22
2025年3月国产数据库中标情况一览:TDSQL大单622万、GaussDB大单581万……
通讯员
663次阅读
2025-04-10 15:35:48
数据库,没有关税却有壁垒
多明戈教你玩狼人杀
533次阅读
2025-04-11 09:38:42
国产数据库需要扩大场景覆盖面才能在竞争中更有优势
白鳝的洞穴
511次阅读
2025-04-14 09:40:20
最近我为什么不写评论国产数据库的文章了
白鳝的洞穴
470次阅读
2025-04-07 09:44:54
【活动】分享你的压箱底干货文档,三篇解锁进阶奖励!
墨天轮编辑部
428次阅读
2025-04-17 17:02:24
2025年4月国产数据库中标情况一览:4个千万元级项目,GaussDB与OceanBase大放异彩!
通讯员
417次阅读
2025-04-30 15:24:06
天津市政府数据库框采结果公布,7家数据库产品入选!
通讯员
403次阅读
2025-04-10 12:32:35
优炫数据库成功入围新疆维吾尔自治区行政事业单位数据库2025年框架协议采购!
优炫软件
349次阅读
2025-04-18 10:01:22
