


历史Prometheus文章推荐:
【原创|译】Prometheus2.X(从2.0.0到2.13.0)十四个重大版本变迁说明
【原创|译文】Prometheus 2.0: 新的存储层极大地提高了Kubernetes和其他分布式系统的监控可伸缩性
基于Prometheus搭建SpringCloud全方位立体监控体系
【原创|译】Prometheus的Counter、Gauge、Summary、Histogram是如何工作的?(完整版)
【文末双十一购书大促】HikariCP可视化监控已支持Prometheus接入
【原创|译】Prometheus 2.X里程碑更新及Prometheus 2.X访问1.X数据
【原创|译】Prometheus将规则Rules从1.X转化为2.0的格式
【2019.11.11】New Features in Prometheus 2.14.0
What queries were running when Prometheus died?
2019.11.18
英文原文:https://www.robustperception.io/evaluating-performance-and-correctness
Prometheus服务器的压缩(Cortex和Thanos均使用的)略好于VictoriaMetrics的10%,此外,VictoriaMetrics并没有像Prometheus那样存储所有的信息。
单词学习:apples-to-apples:这是个非常常见的俗语,指对两个东西的各个方面作一一对应的比较。比如两辆车,apple to apple的比较就是A车尺寸对B车尺寸,A车马力对B车马力,A车最高时速对B车最高时速,等等等等。
There's more to selecting a piece of software than headline numbers.
选择一款软件比选择标题的数字要复杂得多。
At PromCon there was a talk in which the speaker had found that VictoriaMetrics had compression far beyond what other solutions like Thanos have, as in 3-4x. During the social event there were questions from some attendees as to whether there are optimisations that could be adopted by Prometheus or if this might be too good to be true, and what about other factors such as correctness and performance in reading the data back out.
在PromCon的一次演讲中,演讲者发现VictoriaMetrics的压缩能力远远超出了诸如Thanos之类的其他解决方案,例如3-4倍。在社交活动期间,一些与会者提出了这样的一些问题,即Prometheus是否可以采用一些优化方法,或者这种方法是否好得令人难以置信,以及其他因素例如读取数据时的正确性和性能如何。
Based on this I did some quick ad-hoc testing on the Friday of PromCon and gave a lightning talk on it, the results of which were that the Prometheus server's compression (which both Cortex and Thanos use) is slightly better by about 10% than VictoriaMetrics and that in addition VictoriaMetrics was not storing all the information that Prometheus does.
基于此,我在PromCon的星期五进行了一些快速的即席测试,并进行了闪电般的演讲,其结果是Prometheus服务器的压缩(Cortex和Thanos均使用的)略好于VictoriaMetrics的10%,此外,VictoriaMetrics并没有像Prometheus那样存储所有的信息。
There's only so much testing you can do with 15 minutes setup time and lightning talks are only 5 minutes, so I wanted to take a deeper look into everything. The main developer of VictoriaMetrics also corresponded with me asking for more details (the videos aren't up yet at time of writing) plus a fuller write up, and suggested some adjustments to my test setup to make it a bit more realistic and I was also able to point him to the PromQL unittests so he could verify the correctness of their 3rd party PromQL implementation rather than waiting on bug reports to come in.
15分钟的准备时间只能做这么多测试,而快速演讲只有5分钟,所以我想对所有内容进行更深入的了解。VictoriaMetrics的主要开发人员也与我联系,要求提供更多详细信息(撰写本文时,视频尚未更新)以及更完整的文章,并建议对我的测试设置进行一些调整,以使其更加合理切实可行,我当时是还可以将他指向PromQL单元测试,以便他可以验证其第三方PromQL实现的正确性,而不是BUG报告。
This post will also give you an idea of the sort of things to look out for when evaluating any piece of software.
这篇文章也会让你知道在评估任何软件时应该注意哪些事情。
So on to the testing. It's important that testing is as apples to apples as is possible. The test is primarily about compression, so I'll setup a Prometheus that's forwarding everything to VictoriaMetrics via remote write, all with default settings. I'm not going to look at RAM or CPU usage, as it's not a fair comparison. Cortex, Thanos's receiver, or M3DB would be what to compare against as they also hook in to remote write and there's others better placed to do such testing and compare things like replication, auto-rebalancing, tolerance to machine failure etc. across the systems.
接下来是测试。重要的是,测试要尽可能地做到各个方面作一一对应的比较。该测试主要是关于压缩的,所以我将设置一个Prometheus,它通过远程写入
remote write
将所有内容转发到VictoriaMetrics,所有这些都使用默认设置。我不打算看RAM或CPU的使用情况,因为这不是一个公平的比较。Cortex,Thanos的接收器或M3DB将成为比较对象,因为它们还可以连接到远程写入,并且还有其他更好的方法来进行这样的测试,并比较整个系统中的复制,自动重新平衡,机器故障容忍度等。
I also believe in providing enough detail about the setup to allow someone else to reproduce it themselves to verify. In this case I'll once again use the latest stable versions of each, which is now Prometheus 2.14.0 and VictoriaMetrics 1.29.3. It looks like VictoriaMetrics tunes itself based on RAM in the machine, so I'll mention that I've 32GB. Beyond that it's ZFS-on-Linux mirroring over two SSDs in the unlikely event that matters. I'm using my usual expose_many_metrics script scraped once a second, tweaked to have 9 digits after the decimal point on observe to simulate latency metrics more closely (as suggested, my previous test used a completely random float). Note that this setup has no churn. Prometheus is also scraping itself.
我也相信提供足够的细节设置,以允许其他人自己复制它以进行验证。在本例中,我将再次使用每个版本的最新稳定版本,即Prometheus 2.14.0和VictoriaMetrics 1.29.3。看起来VictoriaMetrics会根据计算机中的RAM进行自我调整,因此我要提到我有32GB。除此之外,在不太可能的情况下,ZFS-on-Linux镜像超过两个ssd也是很重要的。我使用的是我常用的每秒曝光一次的expose_many_metrics脚本,将其调整为在观察到的小数点后9位数字,以便更接近地模拟延迟指标(正如建议的那样,我以前的测试使用了完全随机的浮点数)。请注意,此设置没有搅动。Prometheus也正在拼命scraping刮擦自己。
Both systems have a snapshot feature, so that seems the fairest way to compare disk usage as fixed overhead like Prometheus's WAL should not be taken into account. We can take snapshots at the same time with:
两种系统都具有快照功能,因此似乎不应该考虑比较磁盘使用情况的最公平方法,因此将磁盘使用量与固定开销(如Prometheus的WAL)进行比较的最公平方法似乎不应该被考虑在内。我们可以通过以下方式同时拍摄快照:
curl -XPOST http://localhost:9090/api/v1/admin/tsdb/snapshot &
curl http://localhost:8428/snapshot/create
wait复制
Due to the ways both systems do snapshots, a few uncommon options are needed to get du to do the right thing here:
由于两种系统做快照的方式不同,需要一些不常见的选项来让
du
做正确的事情:
$ du -hlLs prometheus-2.14.0.linux-amd64/data/snapshots/* victoria-metrics-data/snapshots/*
90M prometheus-2.14.0.linux-amd64/data/snapshots/20191115T130459Z-78629a0f5f3f164f
78M victoria-metrics-data/snapshots/20191115130459-15D7566ABFAD1118复制
That's after half an hour, so let's look at some other things I noticed in passing while we're waiting for that to build up into a more realistic amount of data where processes like compaction have had a chance to kick in.
那是半个小时后的事,所以让我们看看我在等待过程中发现的其他一些东西,这些东西正在累积到更实际的数据量中,诸如压缩之类的过程有机会发挥作用。
So let's try some queries to see if the data is the same in both systems, which we'd expect to be identical bar whatever tiny delay should be involved in ingesting data into VictoriaMetrics via remote write. Both systems support the query API, so we can do:
因此,让我们尝试一些查询,看看这两个系统中的数据是否相同,我们希望这两个系统中的数据是相同的,包括通过远程写入将数据输入到VictoriaMetrics中所涉及的任何微小的延迟都希望是相通的。两个系统都支持查询API,所以我们可以做到:
$ for i in 9090 8428; do curl -g "http://localhost:$i/api/v1/query?query=prometheus_tsdb_blocks_loaded"; echo; done
{"status":"success","data":{"resultType":"vector","result":[{"metric":{"__name__":"prometheus_tsdb_blocks_loaded","instance":"localhost:9090","job":"prometheus"},
"value":[1573818712.325,"0"]}]}}
{"status":"success","data":{"resultType":"vector","result":[{"metric":{"__name__":"prometheus_tsdb_blocks_loaded","instance":"localhost:9090","job":"prometheus"},
"value":[1573818652,"0"]}]}}复制
The value is 0 in both cases, as you'd expect. The timestamps are a different though, beyond what could be explained by ingestion delay. The first thing to note is that Prometheus has a fractional part to the timestamp whereas VictoriaMetrics does not. This looks to be as there's no explicit time passed so the current time should be used, and Prometheus is using a millisecond resolution time whereas VictoriaMetrics is using seconds. If an explicit timestamp is sent it's fine, though the rounding is different if there's more precision than that. These are both small things, you couldn't tell the difference in Grafana as it'll send in integers for time.
正如您所期望的,在两种情况下该值均为0。但是,时间戳是不同的,超出了摄取延迟可以解释的范围。首先要注意的是,Prometheus只有时间戳的一小部分,而VictoriaMetrics没有。这似乎是因为没有明确的时间,所以应该使用当前时间,Prometheus使用的是毫秒级的时间分辨率,而VictoriaMetrics的则是秒。如果发送了明确的时间戳,则没有问题,但如果精度高于此值,则四舍五入会有所不同。这些都是小事,你看不出Grafana的区别,因为它会发送整数。
There's a bigger issue here though - the timestamps are different by a minute! Let's try with an explicit date and trimming down the output for sanity:
不过,这里还有一个更大的问题-时间戳相差一分钟!让我们尝试使用一个明确的日期,并减少输出以保持稳定:
d=$(date +%s); echo $d; for i in 9090 8428; do curl -g "http://localhost:$i/api/v1/query?query=prometheus_tsdb_blocks_loaded&time=$d"; echo; done
1573819392
"value":[1573819392,"0"]
"value":[1573819332,"0"]复制
This isn't any better, VictoriaMetrics is altering the query we're sending in. Let's try with time() so we're not depending on the database:
这也好不到哪里去,VictoriaMetrics正在更改我们要发送的查询。让我们使用time()尝试一下,这样我们就不必依赖数据库了:
d=$(date +%s); echo $d; for i in 9090 8428; do curl -g "http://localhost:$i/api/v1/query?query=time()&time=$d"; echo; done
1573819467
{"resultType":"scalar","result":[1573819467,"1573819467"]}
{"resultType":"vector","result":[{"metric":{},"value":[1573819407,"1573819407"]}]}复制
So the value has the wrong type for VictoriaMetrics (scalar vs instant vector), and is still off by a minute. This is not a correct output. Weirdly if I use an earlier time like 100 the correct value is returned. It looks like the discontinuity is for time values in the last minute, so queries for the last minute of data will return incorrect misleading results.
因此,该值的VictoriaMetrics(标量vs即时矢量)的类型是错误的,并且仍然差一分钟。这不是正确的输出。奇怪的是,如果我使用更早的时间(例如100),则会返回正确的值。看起来不连续是针对最后一分钟的时间值,因此对最后一分钟数据的查询将返回不正确的误导性结果。
Let's look more at the type mismatch:
让我们再看一下类型不匹配:
$ for i in 9090 8428; do curl -g "http://localhost:$i/api/v1/query?query=sum(time())"; echo; done
{"status":"error","errorType":"bad_data","error":"invalid parameter 'query': parse error at char 12: expected type instant vector in aggregation expression, got scalar"}
{"status":"success","data":{"resultType":"vector","result":[{"metric":{},"value":[1573819787,"1573819787"]}]}}复制
So VictoriaMetrics is returning a result where it should be producing a type error, as you can't aggregate a scalar. What does this mean for the usual time() - timestamp pattern used for alerting?
因此,VictoriaMetrics返回一个类型错误的结果,因为您无法聚合标量。这对于通常用于警报的time() - timestamp 模式意味着什么?
$ for i in 9090 8428; do curl -g "http://localhost:$i/api/v1/query?query=time()-prometheus_tsdb_blocks_loaded"; echo; done
{"status":"success","data":{"resultType":"vector","result":[{"metric":{"instance":"localhost:9090","job":"prometheus"},"value":[1573819930.391,"1573819930.391"]}]}}
{"status":"success","data":{"resultType":"vector","result":[{"metric":{"instance":"localhost:9090","job":"prometheus"},"value":[1573819870,"1573819870"]}]}}复制
That's not right. A series with no labels should not match a series with labels, this is an explicit design decision in PromQL to keep the language consistent and predictable. More explicitly:
那是不对的。没有标签的系列不应与带有标签的系列匹配,这是PromQL中的一个明确的设计决策,旨在保持语言的一致性和可预测性。更明确地:
$ for i in 9090 8428; do curl -g "http://localhost:$i/api/v1/query?query=vector(0)-prometheus_tsdb_blocks_loaded"; echo; done
{"status":"success","data":{"resultType":"vector","result":[]}}
{"status":"success","data":{"resultType":"vector","result":[{"metric":{"instance":"localhost:9090","job":"prometheus"},"value":[1573819980,"0"]}]}}复制
So vector matching is broken in VictoriaMetrics when one side has an instant vector with one sample with no labels. Even the scalar() function doesn't return a scalar:
因此,当一侧有一个即时矢量,一侧带有一个没有标签的样本,矢量匹配在VictoriaMetrics中就被破坏了。即使是scalar()函数也不返回标量:
$ for i in 9090 8428; do curl -g "http://localhost:$i/api/v1/query?query=scalar(vector(1))"; echo; done
{"status":"success","data":{"resultType":"scalar","result":[1573820388.447,"1"]}}
{"status":"success","data":{"resultType":"vector","result":[{"metric":{},"value":[1573820328,"1"]}]}}复制
So there's a few issues with the PromQL implementation of VictoriaMetrics, which our unittests will hopefully help them find and fix.
因此,VictoriaMetrics的PromQL实现存在一些问题,我们的单元测试有望帮助他们找到并修复这些问题。
Let's look at data storage, as for a apples to apples comparison we want to know that both databases contain the same data. Given that we know that VictoriaMetrics doesn't return correct data for the last minute via the query API, let's look a little further back:
让我们看一下数据存储,各个方面作一一对应的比较,我们想知道两个数据库都包含相同的数据。鉴于我们知道VictoriaMetrics在最后一分钟不会通过查询API返回正确的数据,让我们回顾一下:
$ d=$(date +%s -d'61 seconds ago'); for i in 9090 8428; do curl -g "http://localhost:$i/api/v1/query?query=go_memstats_gc_cpu_fraction&time=$d"; echo; done
"value":[1573821987,"0.0008032872187757047"]}, "value":[1573821987,"0.0003083021835007435"]}]}}
"value":[1573821987,"0.0008032872187757"]}, "value":[1573821987,"0.0003083021835007"]}]}复制
So for both of these time series we see that VictoriaMetrics is lossy. To be certain I have verified that this isn't just a floating point rendering issue, these are different numbers with different bit representations.
因此,对于这两个时间序列,我们都可以看到VictoriaMetrics是有损的。可以肯定地说,我已经证实这不仅仅是浮点渲染问题,它们是具有不同位表示形式的不同数字。
Let's see about staleness handling. I briefly stopped the exposer:
让我们看一下陈旧性处理。我暂时停止了曝光器:
$ d=1573822392; for i in 9090 8428; do curl -g "http://localhost:$i/api/v1/query?query=up{job=\"expose\"}[5s]&time=$d"; echo; done
"values":[[1573822387.664,"1"],[1573822388.664,"0"],[1573822389.664,"0"],[1573822390.664,"0"],[1573822391.664,"1"]]}]}}
"values":[[1573822387.664,"1"],[1573822388.664,"0"],[1573822389.664,"0"],[1573822390.664,"0"],[1573822391.664,"1"]]}]}}复制
And both have the data expected when queried for a range vector:
当查询距离向量时,两者都有预期的数据:
$ d=1573822392; for i in 9090 8428; do curl -g "http://localhost:$i/api/v1/query?query=go_goroutines{job=\"expose\"}[5s]&time=$d"; echo; done
"values":[[1573822387.664,"6"],[1573822391.664,"6"]]}]}}
"values":[[1573822387.664,"6"],[1573822391.664,"6"]]}]}}复制
So let's check this with a range query to see where the series disappears and reappears:
因此,让我们通过范围查询进行检查,以查看该系列消失并重新出现的位置:
$ for i in 9090 8428; do curl -g "http://localhost:$i/api/v1/query_range?query=go_goroutines{job=\"expose\"}&start=1573822388&end=1573822392&step=1"; echo; done
"values":[[1573822388,"6"],[1573822392,"6"]]}]}}
"values":[[1573822388,"6"],[1573822389,"6"],[1573822390,"6"],[1573822391,"6"],[1573822392,"6"]]}]}}复制
VictoriaMetrics is incorrectly returning time series that are stale. Let's check for NaNs more generally:
VictoriaMetrics错误地返回了陈旧的时间序列。让我们更笼统地检查NaN:
$ d=$(date +%s -d'61 seconds ago'); for i in 9090 8428; do curl -g "http://localhost:$i/api/v1/query?query=prometheus_rule_evaluation_duration_seconds{quantile=\"0.5\"}&time=$d"; echo; done
{"status":"success","data":{"resultType":"vector","result":[{"metric":{"__name__":"prometheus_rule_evaluation_duration_seconds","instance":"localhost:9090","job":"prometheus","quantile":"0.5"},"value":[1573822973,"NaN"]}]}}
{"status":"success","data":{"resultType":"vector","result":[]}复制
So when comparing how good the compression is we need to keep in mind that VictoriaMetrics is both lossy, and dropping NaNs (and possibly other non-real values) whereas Prometheus is lossless and handling the non-real values including stale markers correctly.
因此,在比较压缩效果的好坏时,我们需要记住,VictoriaMetrics既是有损的,并且会丢弃NaN(以及可能的其他非真实值),而Prometheus是无损的,并且可以正确处理包括陈旧标记的非真实值。
While waiting on the data for compression to build up, one thing I noticed was that there was a big difference in the index sizes of the snapshots. Prometheus has 8.8MB while VictoriaMetrics has 427KB. Both seem to be using inverted indexes, and I know the Prometheus implementation is pretty well optimised so this makes me wonder what the tradeoff is as merely clever memory tricks shouldn't produce a 20x difference. Does it generate index at startup or on the fly, rather than Prometheus's approach of mmaping the posting lists? Might it use compression over the whole index so it's smaller, but slower? I haven't gotten my head around all the code yet, even with some pointers from the author.
在等待压缩数据建立时,我注意到一件事,即快照的索引大小有很大差异。Prometheus有8.8MB,而VictoriaMetrics有427KB。两者似乎都在使用倒排索引,而且我知道Prometheus的实现已经进行了很好的优化,所以这让我想知道两者之间的权衡,因为仅仅聪明的内存技巧不会产生20倍的差异。它是在启动时还是在运行时生成索引,而不是像Prometheus那样映射发布列表?可能会在整个索引上使用压缩,以使其更小但更慢吗?我还没弄清楚所有代码,即使有作者的一些指点。
So let's get some indicative numbers. Prometheus has a good set of micro-benchmarks for index lookups so I inserted the same data into VictoriaMetrics and ran the same queries.
因此,让我们获取一些指示性数字。Prometheus 为索引查找提供了一套很好的微基准,所以我把相同的数据插入VictoriaMetrics中并运行相同的查询。
Here's the results for Prometheus:
这是Prometheus的结果
n="1" 223438887 ns/op
n="1",j="foo" 139778111 ns/op
j="foo",n="1" 148326039 ns/op
n="1",j!="foo" 131558423 ns/op
i=~".*" 6571913235 ns/op
i=~".+" 7082434732 ns/op
i=~"" 1195147483 ns/op
i!="" 7092451903 ns/op
n="1",i=~".*",j="foo" 194365800 ns/op
n="1",i=~".*",i!="2",j="foo" 203273368 ns/op
n="1",i!="" 459549826 ns/op
n="1",i!="",j="foo" 361565138 ns/op
n="1",i=~".+",j="foo" 378793537 ns/op
n="1",i=~"1.+",j="foo" 94137385 ns/op
n="1",i=~".+",i!="2",j="foo" 413769153 ns/op
n="1",i=~".+",i!~"2.*",j="foo" 434932250 ns/op复制
Comparing a micro-benchmark of index lookups to an end-to-end query isn't exactly apples to apples, however the index lookups should dominate and we're only looking for significant differences beyond say 100ms. I went with an aggregation to remove JSON marshalling from the equation (e.g. sum({n="1"})), and as VictoriaMetrics seems to have caching in its index implementation I ran each query five times and took the fastest result to even the playing field. I noticed that VictoriaMetrics seemed to be using multiple cores for a query, whereas Prometheus only uses one per query so I used GOMAXPROCS=1 to be fair and measure total CPU usage for each and also set both merge concurrency flags to 1 just in case. I also needed to bump -search.maxUniqueTimeseries on VictoriaMetrics so the queries would complete.
将索引查找的微基准与端到端查询进行比较并不完全是对等的,但是索引查找应该占主导地位,我们只是在寻找超过100ms的显着差异。我使用了一个聚合来从等式中删除JSON编组(例如
sum({n="1"})
),并且因为VictoriaMetrics的索引实现中似乎有缓存,所以我将每个查询运行了五次,并以最快的速度获得结果。我注意到VictoriaMetrics似乎在一个查询中使用多个内核,而Prometheus每个查询只使用一个核,因此我使用GOMAXPROCS = 1来衡量每个CPU的总使用量,并同时将两个合并并发标志都设置为1,以防万一。我还需要了解VictoriaMetrics的-search.maxUniqueTimeseries
,以让查询可以完成。
For example:
例如:
$ for i in {0..5}; do time curl -g 'http://localhost:9000/api/v1/query?query=sum({n="1"})&time=1573829440'; done 2>&1 > /dev/null | fgrep real | cut -d 'm' -f 2 | sort -g | head -1
2.740s复制
Running them all, I got:
运行它们,我得到:
n="1" 6.479s
n="1",j="foo" 1.760s
j="foo",n="1" 1.749s
n="1",j!="foo" 3.911s
i=~".*" 30.547s
i=~".+" 0.011s
i=~"" 0.015s
i!="" 30.545s
n="1",i=~".*",j="foo" 1.746s
n="1",i=~".*",i!="2",j="foo" 1.787s
n="1",i!="" 6.501s
n="1",i!="",j="foo" 1.817s
n="1",i=~".+",j="foo" 0.010s
n="1",i=~"1.+",j="foo" 0.008s
n="1",i=~".+",i!="2",j="foo" 0.015s
n="1",i=~".+",i!~"2.*",j="foo" 0.008s复制
There's two timeouts there up at 30s, and {i=~""} is faster for VictoriaMetrics though that's not a query you would ever run (it'd be rejected by a sanity check in Prometheus). More interesting are all the queries taking around 10ms, which all contain i=~".+" which turn out to all be incorrectly producing empty results. Which indicates that the speed of {i=~""} may actually be due to it happening to produce the right answer, but in the wrong way.
在30秒处有两次超时,
{i=~""}
对于VictoriaMetrics来说是更快的,尽管这不是您会运行的查询(在Prometheus中,健全性检查会拒绝它)。更为有趣的是,所有查询都在10毫秒左右的时间,其中包含的所有查询i=~".+"
都错误地产生了空结果。这表明{i=~""}
速度实际上可能是由于它碰巧以错误的方式产生了正确的答案。
Removing the incorrect results and applying benchcmp for easier reading where, we get:
删除不正确的结果,应用benchcmp更容易阅读,我们得到:
op Prom ns/op VM ns/op delta
n="1" 223438887 6479000000 +2799.67%
n="1",j="foo" 139778111 1760000000 +1159.14%
j="foo",n="1" 148326039 1749000000 +1079.16%
n="1",j!="foo" 131558423 3911000000 +2872.82%
i=~".*" 6571913235 30s timeout +????.??%
i!="" 7092451903 30s timeout +????.??%
n="1",i=~".*",j="foo" 194365800 1746000000 +798.31%
n="1",i=~".*",i!="2",j="foo" 203273368 1787000000 +779.11%
n="1",i!="" 459549826 6501000000 +1314.65%
n="1",i!="",j="foo" 361565138 1817000000 +402.54%复制
As indicated above this is not exactly apples to apples, however the differences here are well beyond what could be explained by the simplifications I took to make this easier to test. While I personally believe in throughput over latency in cases like this, for completeness I did a run with GOMAXPROCS set to default on my 4 core desktop (which is also doing desktopy things) I get results that are ~2-4x lower latency at a higher CPU usage from VictoriaMetrics. However even granting that indulgence Prometheus's TSDB remains ~3-10x lower latency in all cases, or at least ~4-28x faster when comparing throughput.
正如上面指出的,这并不完全一致的,但是这里的区别远远超出了我为简化测试所进行的简化所能解释的范围。尽管我本人认为在这种情况下吞吐量会超过延迟,但为完整起见,我在4核台式机上运行了GOMAXPROCS(将其设置为默认值)(这也是在做台式机操作),但我得到的结果是:VictoriaMetrics提高了CPU使用率。然而,即使允许Prometheus的TSDB在所有情况下都能保持低3-10倍的延迟,或在比较吞吐量时至少快了约4-28倍。
So it would appear at what is a moderate index size of 5M time series with no ingestion or other activity ongoing, a standalone Prometheus server is substantially faster at index lookups than VictoriaMetrics at the cost of what is in the grand scheme of things a small bit more disk space for the index. In addition VictoriaMetrics does not appear to have implemented all regular expression matchers correctly.
因此,它看起来像是5M时间序列的中等索引大小,并且没有正在进行的摄取或其他活动,因此,独立的Prometheus服务器在进行索引查找时比VictoriaMetrics快得多,代价是在整体的计划中为索引多一点磁盘空间。此外,VictoriaMetrics似乎没有正确实现所有正则表达式匹配器。
Now that's it's been a while, let's see how the disk usage is doing:
现在已经有一段时间了,让我们看看磁盘使用情况如何:
13016742 prometheus-2.14.0.linux-amd64/data/snapshots/20191118T100200Z-490bd268b68e6a3f
11459543 victoria-metrics-data/snapshots/20191118100200-15D7566ABFAD112D复制
So VictoriaMetrics is using around 12% less disk space here. The ratio of Prometheus to VictoriaMetrics usage started out higher though, generally has been trending down, and seems to have a bit of a sawtooth pattern:
因此,VictoriaMetrics在这里使用的磁盘空间减少了大约12%。Prometheus与VictoriaMetrics的使用比率开始时较高,但总体上呈下降趋势,并且似乎有点锯齿状:
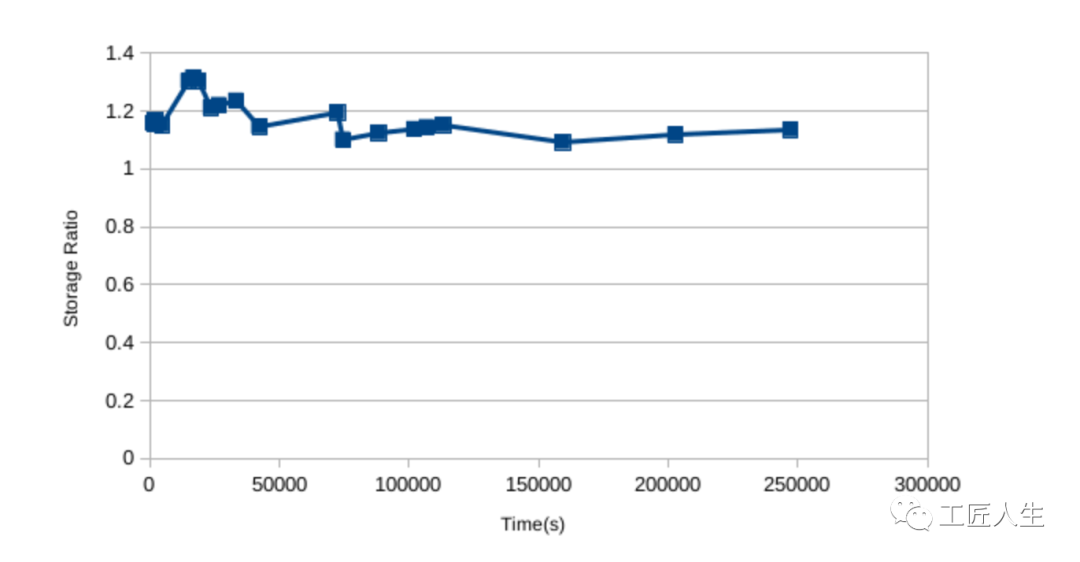
Given the results from my lightning talk, I'd expect this to get to the point where Prometheus had lower usage if I left it running for longer. I don't believe this level of difference is important though, as we're only talking 10% in some direction With a system taking in 1M samples/s and offloading to S3 via something like Thanos that 10% difference only comes to storage costs of a couple hundred of dollars for a full year's data over a year. It's not nothing, but it's only a pretty small factor to be considered along engineer salaries and the other compute costs involved in monitoring.
考虑到我的快速演讲的结果,如果我让它运行更长的时间,我希望这会达到Prometheus使用率更低的地步。但是我不认为这种差异的重要性很重要,由于我们只讨论了在某些方向上的10%,而系统每秒要采集100万个样本,并通过Thanos这样的方式将数据卸载到S3,那么10%的差异只体现在存储成本上,一年下来存储一整年的数据需要几百美元。这不是什么,与工程师的薪水以及监控中涉及的其他计算成本相比,这只是一个很小的因素。
In summary VictoriaMetrics may use a small bit less disk space than Prometheus depending on usage, however this is at the cost of losing precision, dropping NaNs, and not having the benefits of staleness handling. The indexes are smaller on disk, but lookups are several times less performant compared to a stock Prometheus, before we even get to discuss the much larger amounts of data that are typically involved in distributed systems like Thanos, Cortex, and M3DB. The above also shows the risks of independently implementing a language like PromQL from scratch rather than reusing the Prometheus code like everyone else does, as there's several examples where VictoriaMetrics returns an incorrect result. There's lots of little details you have to get right, and these are only the issues that I came across by chance while playing around. I imagine these issues will gradually be addressed, however I'd advise caution as things stand. Disk is cheap, humans having to deal with subtle and not so subtle semantic issues much less so.
总之,根据使用情况,VictoriaMetrics使用的磁盘空间可能比Prometheus少一点,但这是以丢失精度、丢弃NaNs和不具有处理陈旧性为代价的。在我们讨论像Thanos、Cortex和M3DB这样的分布式系统中涉及的大量数据之前,磁盘上的索引较小,但与Stock Prometheus相比,查找的性能要低几倍。上面还展示了从头开始独立实现PromQL之类的语言,而不是像其他所有人一样重复使用Prometheus代码的风险,因为有几个示例中VictoriaMetrics返回了错误的结果。您必须弄清许多小细节,而这些只是我在玩耍时偶然遇到的问题。我认为这些问题将逐步解决,但是我建议您谨慎处理。磁盘很便宜,人类不得不处理细微和不那么细微的语义问题。
A good next step would be if someone did a full comparison between Thanos, Cortex, and M3DB with larger data volumes, as that's where VictoriaMetrics positions itself.
如果有人能在Thanos、Cortex和M3DB之间进行更大数据量的全面比较,那将是一个不错的下一步,因为这正是VictoriaMetrics的定位。
数据库及数据库连接池领域的新书推荐,京东、淘宝、当当有售:

你点的每个“在看”,我都认真当成了喜欢 复制

