


如何使用performance_schema的等待事件来排查数据库性能瓶颈
配置表启用等待事件的采集与记录
修改setup_instruments的enabled和timed字段为yes,表示启动对应的instruments。
修改setup_consumers的enabled字段为yes,启动等待事件的consumers。
mysql> use performance_schema Reading table information for completion of table and column names You can turn off this feature to get a quicker startup with -A Database changed mysql> update setup_instruments set enabled='yes',timed='yes' where name like 'wait/%'; Query OK, 331 rows affected (0.01 sec) Rows matched: 385 Changed: 331 Warnings: 0 mysql> update setup_consumers set enabled='yes' where name like '%wait%'; Query OK, 3 rows affected (0.01 sec) Rows matched: 3 Changed: 3 Warnings: 0复制
[root@balabala ~]# sysbench --db-driver=mysql --mysql-table-engine=innodb --mysql-host=127.0.0.1 --mysql-port=3307 --mysql-db=sbtest --mysql-user='sbtest' --mysql-password='123' --test=/usr/share/sysbench/tests/include/oltp_legacy/oltp.lua --oltp-table-ize=5000000 --oltp-tables-count=8 --num-threads=16 --max-time=1800 --max-requests=0 --report-interval=3 prepare WARNING: the --test option is deprecated. You can pass a script name or path on the command line without any options. WARNING: --num-threads is deprecated, use --threads instead WARNING: --max-time is deprecated, use --time instead sysbench 1.0.20 (using bundled LuaJIT 2.1.0-beta2) Creating table 'sbtest1'... Inserting 10000 records into 'sbtest1' Creating secondary indexes on 'sbtest1'... Creating table 'sbtest2'... Inserting 10000 records into 'sbtest2' Creating secondary indexes on 'sbtest2'... Creating table 'sbtest3'... Inserting 10000 records into 'sbtest3' Creating secondary indexes on 'sbtest3'... Creating table 'sbtest4'... Inserting 10000 records into 'sbtest4' Creating secondary indexes on 'sbtest4'... Creating table 'sbtest5'... Inserting 10000 records into 'sbtest5' Creating secondary indexes on 'sbtest5'... Creating table 'sbtest6'... Inserting 10000 records into 'sbtest6' Creating secondary indexes on 'sbtest6'... Creating table 'sbtest7'... Inserting 10000 records into 'sbtest7' Creating secondary indexes on 'sbtest7'... Creating table 'sbtest8'... Inserting 10000 records into 'sbtest8' Creating secondary indexes on 'sbtest8'...复制
[root@balabala ~]# sysbench --db-driver=mysql --mysql-table-engine=innodb --mysql-host=127.0.0.1 --mysql-port=3307 --mysql-db=sbtest --mysql-user='sbtest' --mysql-password='123' --test=/usr/share/sysbench/tests/include/oltp_legacy/oltp.lua --oltp-table-ize=5000000 --oltp-tables-count=8 --num-threads=16 --max-time=1800 --max-requests=0 --report-interval=3 run WARNING: the --test option is deprecated. You can pass a script name or path on the command line without any options. WARNING: --num-threads is deprecated, use --threads instead WARNING: --max-time is deprecated, use --time instead sysbench 1.0.20 (using bundled LuaJIT 2.1.0-beta2) Running the test with following options: Number of threads: 16 Report intermediate results every 3 second(s) Initializing random number generator from current time Initializing worker threads... Threads started! [ 3s ] thds: 16 tps: 754.15 qps: 15175.54 (r/w/o: 10629.08/2125.22/2421.24) lat (ms,95%): 37.56 err/s: 0.99 reconn/s: 0.00 [ 6s ] thds: 16 tps: 748.72 qps: 14980.83 (r/w/o: 10489.82/2557.87/1933.15) lat (ms,95%): 39.65 err/s: 0.00 reconn/s: 0.00 [ 9s ] thds: 16 tps: 744.99 qps: 14904.87 (r/w/o: 10432.24/2559.98/1912.65) lat (ms,95%): 38.25 err/s: 0.33 reconn/s: 0.00 [ 12s ] thds: 16 tps: 733.68 qps: 14666.92 (r/w/o: 10264.84/2534.38/1867.70) lat (ms,95%): 41.10 err/s: 0.00 reconn/s: 0.00复制
此时可以通过 iostate -x 2 5 ,top 等查询系统性能,但是这些在数据库内部事件信息是如何体现的呢?
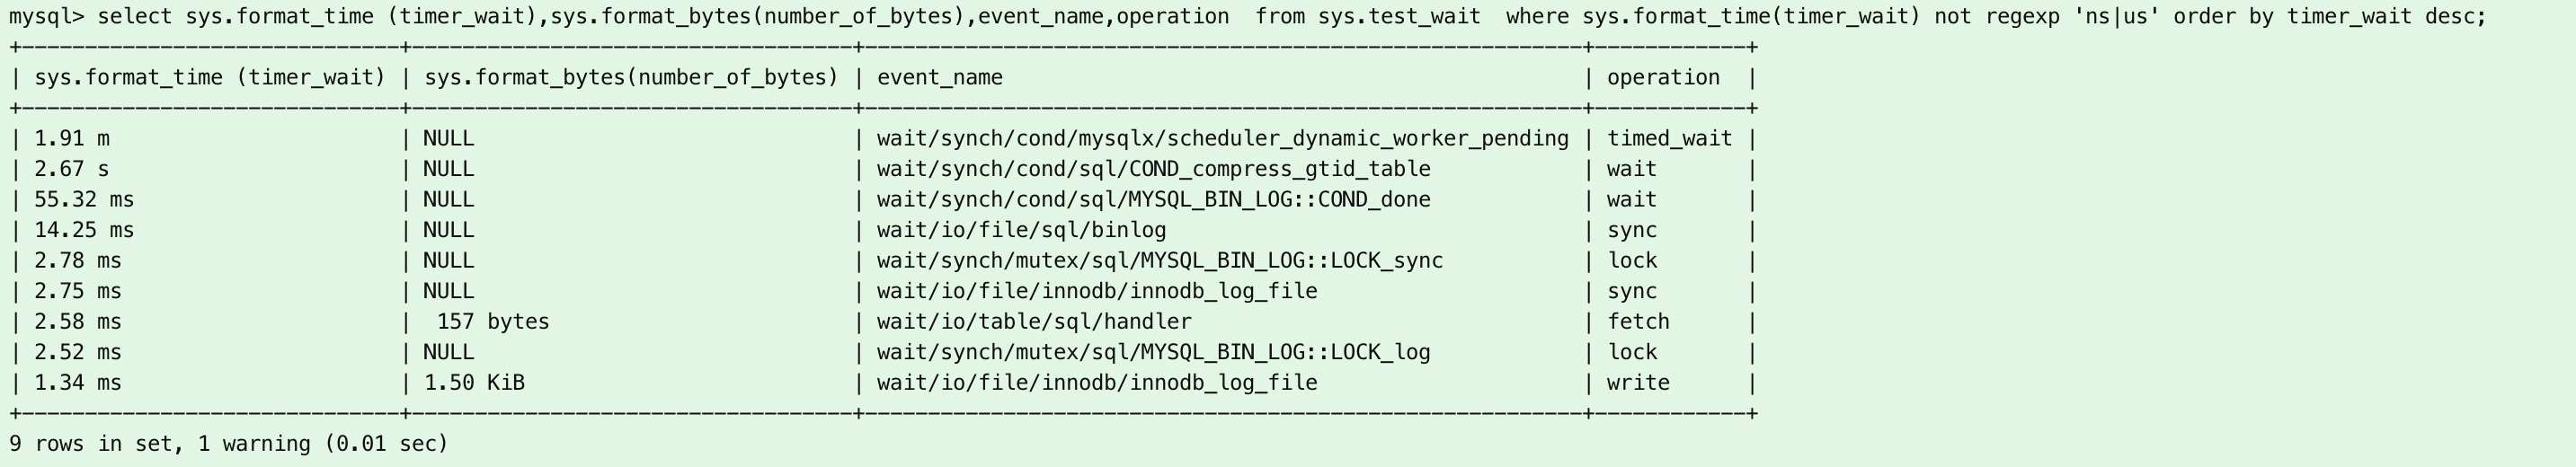
为例方便等待事务的统计,先创建一个试图,用于实时统计当前的等待事件(非历史数据) mysql> create view sys.test_wait as select sum(timer_wait) as timer_wait, sum(number_of_bytes) as number_of_bytes , event_name,operation from events_waits_current where event_name!='idle' group by event_name,operation; Query OK, 0 rows affected (0.02 sec)复制

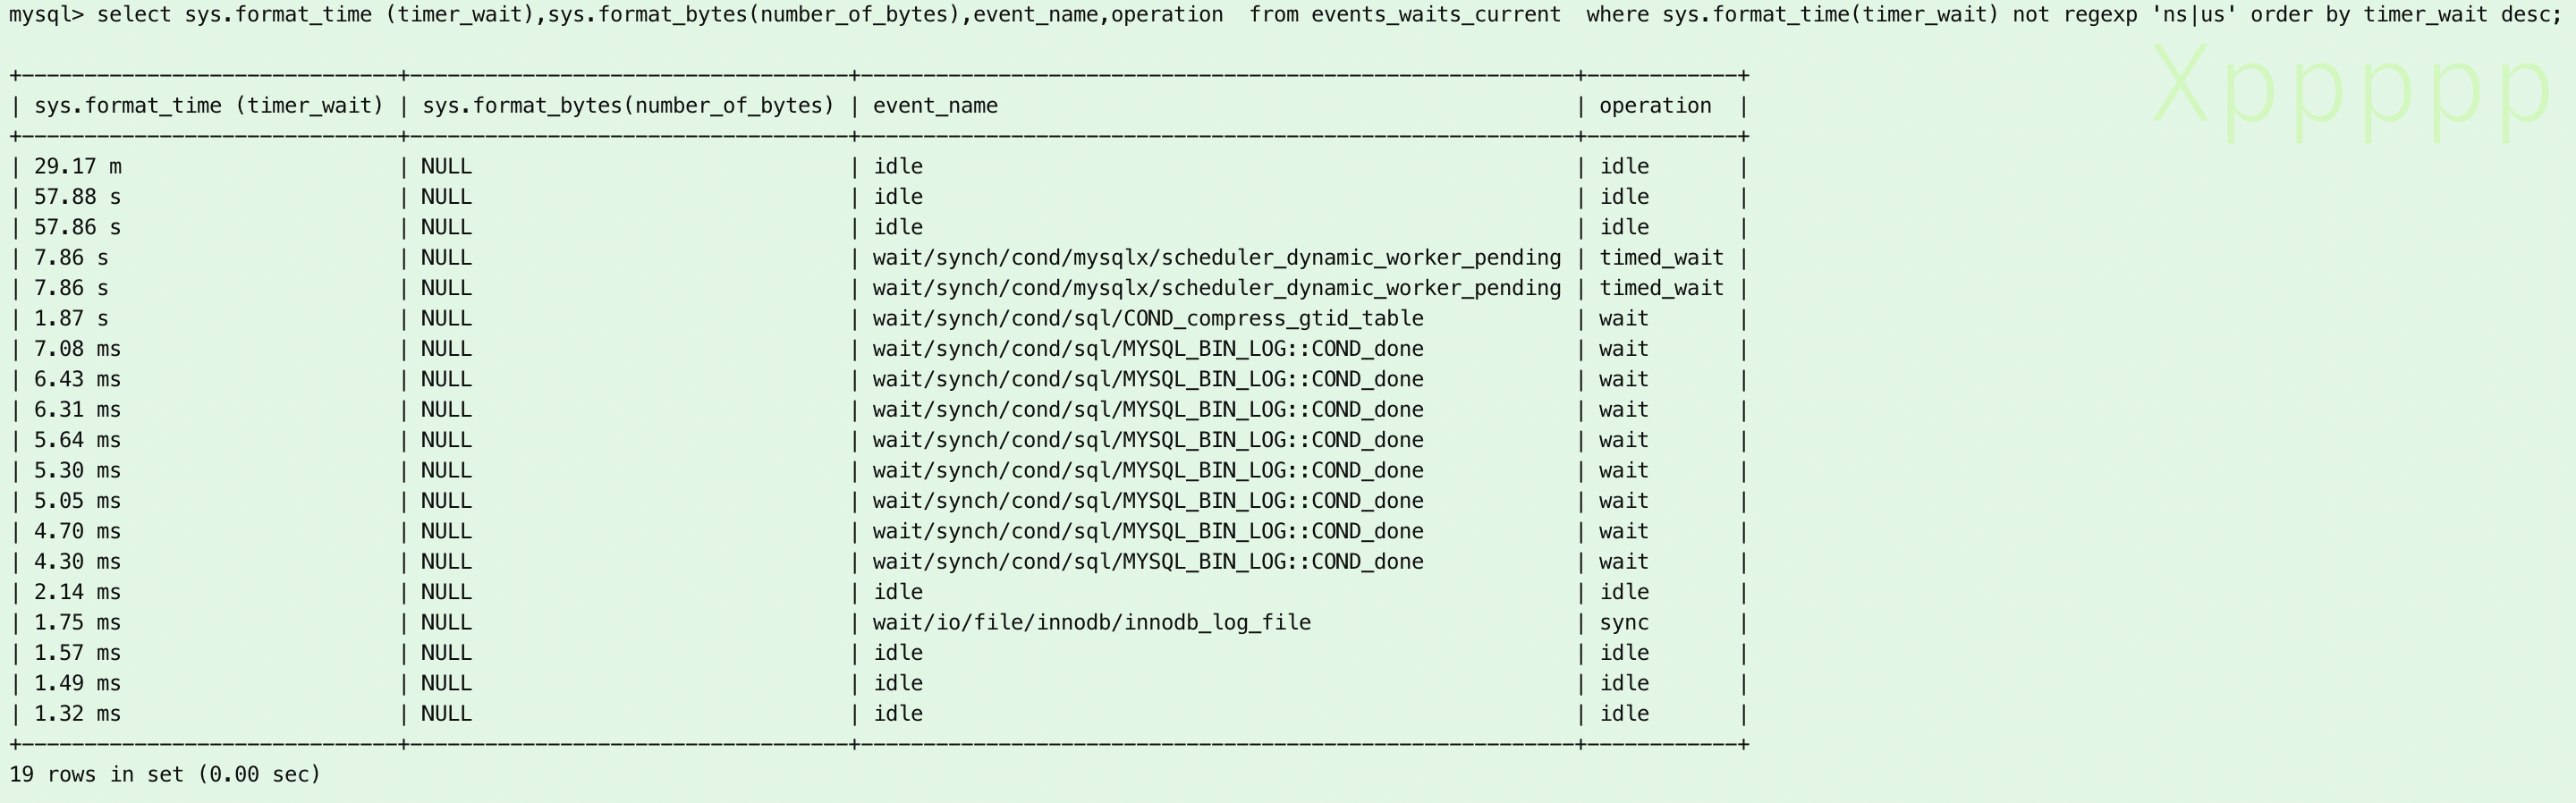
也可以直接查询event_waits_current表 ,返回的数据会比较多且对凡蝴蝶结过没有分组聚合。

可以通过这个方法看到再MySQL数据库内部最为耗时的部分,并为此进行性能优化。
总结
在MySQL上线之前,可以通过类似的方法进行MySQL数据的性能测试,压测的时候可以大致确定MySQL的性能瓶颈方向。
复制
「喜欢这篇文章,您的关注和赞赏是给作者最好的鼓励」
关注作者
【版权声明】本文为墨天轮用户原创内容,转载时必须标注文章的来源(墨天轮),文章链接,文章作者等基本信息,否则作者和墨天轮有权追究责任。如果您发现墨天轮中有涉嫌抄袭或者侵权的内容,欢迎发送邮件至:contact@modb.pro进行举报,并提供相关证据,一经查实,墨天轮将立刻删除相关内容。
评论
相关阅读
【MySQL 30周年庆】MySQL 8.0 OCP考试限时免费!教你免费领考券
墨天轮小教习
2943次阅读
2025-04-25 18:53:11
MySQL 30 周年庆!MySQL 8.4 认证免费考!这次是认真的。。。
严少安
850次阅读
2025-04-25 15:30:58
【活动】分享你的压箱底干货文档,三篇解锁进阶奖励!
墨天轮编辑部
493次阅读
2025-04-17 17:02:24
MySQL 9.3 正式 GA,我却大失所望,新特性亮点与隐忧并存?
JiekeXu
430次阅读
2025-04-15 23:49:58
3月“墨力原创作者计划”获奖名单公布
墨天轮编辑部
372次阅读
2025-04-15 14:48:05
MySQL 8.0 OCP 1Z0-908 考试解析指南(二)
JiekeXu
287次阅读
2025-04-30 17:37:37
记录MySQL数据库的一些奇怪的迁移需求!
陈举超
277次阅读
2025-04-15 15:27:53
SQL优化 - explain查看SQL执行计划(下)
金同学
268次阅读
2025-05-06 14:40:00
MySQL 8.0 OCP 1Z0-908 考试题解析指南
青年数据库学习互助会
248次阅读
2025-04-30 12:17:54
MySQL 30 周年庆!MySQL 8.4 认证免费考!这次是认真的。。。
数据库运维之道
231次阅读
2025-04-28 11:01:25
热门文章
主从复制报错2061:Authentication plugin 'caching_sha2_password' reported error:Authentication require secure connection
2020-08-31 18959浏览
xtrabackup压缩备份和恢复
2021-03-01 8826浏览
MySQL中的decode()、encode()、AES_ENCRYPT() AES_DECRYPT()
2020-12-31 7486浏览
xtrabackup进行单表备份
2020-12-31 5174浏览
redis failover命令
2021-05-30 4266浏览
目录
