


有多种方法可以加速收集优化器统计信息的过程,但众所周知,我并不能确定一个简单的改变会产生多大的效果。如果你曾经问过自己:“为什么统计信息的收集花了这么久,我能为此做些什么呢?”,那么,这篇文章正适合你。
如果你已经对收集统计信息的方法很熟悉了。你可以跳到文章的结尾,在那里我比较了这些方法并给出了一些建议。
总览
加速统计信息的收集是很难的这种观念,促使DBA们使用ESTIMATE_PERCENT参数(或者其它DBMS_STATS中的其它参数),一个表一个表的控制采集的行数。比如,对于大表可能将评估百分比设为1%,而小表为100%。一些传统脚本也是这么干的:某些系统仍在使用对自动采样性能增强前所创建的存储过程。我们建议设置ESTIMATE_PERCENT=>AUTO_SAMPLE_SIZE的原因之一,是它包含有对唯一值数量的优化,这些优化提供了高性能和准确的统计信息。使用1%的行数采集来收集统计信息,也许可以很快完成,但欠准确的统计信息很可能是其结果,并因此产生欠优的SQL执行计划。
做为控制ESTIMATE_PERCENT的替代方案,通过使用更多的机器资源,收集统计信息的时间也是可以减少的。本文比较了一些场景的前后表现,以及演示如何做到这些。全部的实验示例放到了 GitHub.
我会关注于使用自动统计信息收集,但其经验也可以广泛用于手动统计信息收集(文末提供了一个示例)。示例均运行在 Oracle Database 12c和 Oracle Database 18c的库上。同样的技巧亦可以用于Oracle Database 11g,但是,请注意其使用的资源消费者组的名称是不同的。
选项1 - 默认的统计信息收集
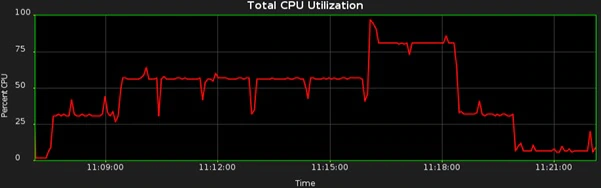
考虑以下随时间变化的CPU消耗的跟踪:

它展示了在自动统计信息收集工作运行期间,我的CPU使用率。而且这期间系统上也没有什么其它的事情发生。可以看到大约有75%的CPU没有被利用上。一旦你知道这个环境有4个每核一个线程的CPU,那么这个事实也就容易理解了。默认情况下,统计信息的收集只使用一个进程(采用单线程工作),并将占用一个CPU核的处理能力。在我的这个案例中,等于25%的利用率(4个核的四分之一)。对于有更高核数的系统,单进程会使用更少的CPU占比。
收集统计信息似乎不是一个重要的问题,如果统计信息收集在绝大多数的夜间可以跑完话,而在特定时间,又没有急需刷新的统计信息,那么不需要做什么。保持事情尽可能简单,并只在需要时才去做出改变。如果你的环境体量较大又(或)不稳定,自动统计信息收集任务可能经常不能在批处理窗口期间完成。换句话说,就是在所有被认为陈旧并完成统计信息刷新前,窗口就关闭了。如果是这种情况,某些表可能会在很长的时间内保持在陈旧的状态。
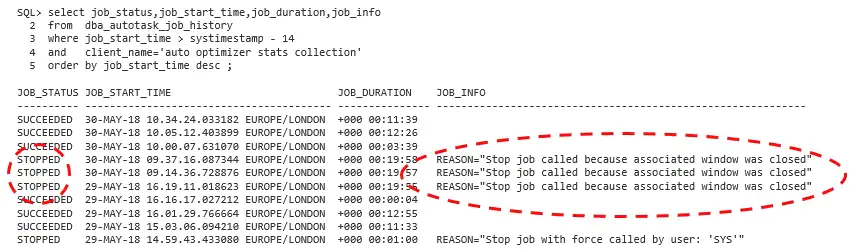
幸运的是,这个情况是容易发现的。如果你查看Oracle Database 12c Release 2中提供的统计信息顾问报告,它会告诉你的。数据字典中也会存储有该信息。在下面的示例中,我的批处理窗口有20分钟长,而自动统计信息收集任务有时会无法完成(状态为STOPPED)。JOB_INFO列会显示原因:自动统计信息收集任务有时会超过20分钟,当批处理窗口关闭时而被终止。
我们要如何处理它呢?我们可以(a) 让批处理窗口更长 并(或)(b)加速统计信息的收集。我计划考虑选项b(因为选项a没什么意思)。
要如何加速统计信息收集呢?如果你的数据库服务器上有资源,可以让更多的资源用于收集统计信息。这可以减少收集统计信息的时间,代价是更大的数据库服务器资源使用率。当然,找到一个有空闲系统资源的窗口时间是必要的。因此,该方案需要系统不能总是运行在100%。
值得注意的是,还有其它一些减少维护统计信息时间的技巧(比如增量统计信息),但其并不在本文范围内。
选项2 - 并行收集统计信息 - AUTO_DEGREE
使用自动采样大小来收集统计信息会启动全表扫描去检查表数据。我们可以利用并行执行,使得这些表扫描用更少的时间完成。例如,为了这样做,你需要识别出大表并定义一个特定的并行度(DOP):
exec dbms_stats.set_table_prefs(user, 'BIG_TABLE', 'DEGREE', 16)复制
有一个更容易,一劳永逸的方法是你可以让Oracle为你来决定DOP:
exec dbms_stats.set_table_prefs(user, 'BIG_TABLE', 'DEGREE', DBMS_STATS.AUTO_DEGREE)复制
一个清晰且简单的方法是在全局级别设置该属性:
exec dbms_stats.set_global_prefs('DEGREE', DBMS_STATS.AUTO_DEGREE)复制
并行执行期间,统计信息收集潜在地会消耗大量的系统资源,所以,你需要考虑如何控制它。当自动统计信息任务执行时,它默认会使用资源管理计划DEFAULT_MAINTENANCE_PLAN和一个名为ORA$AUTOTASK的消费者组。这使得它易于调整和控制你希望用多少资源去收集统计信息。
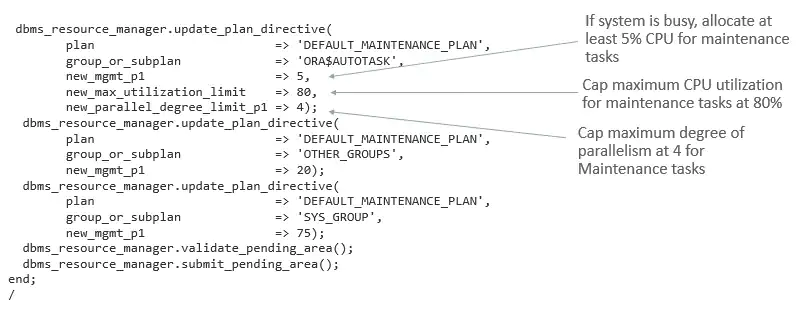
你首先需要确定自动统计信息收集的优先级属性,其取决于在同样时间运行的其它进程。在下面的示例中,自动统计信息收集任务拥有最小5%的CPU,如果数据库上运行的其它任务会争用CPU的话。然而,如果系统并不繁忙,我们允许该任务至多使用80%的CPU(这会保护那些不受数据库控制的进程)。在本例中,会话可以使用的最大并行度是4。控制最大并行度是很有用的,因为你希望确保你不会达到系统所允许的最大的并行服务进程数(后文中它会变得更有意义)
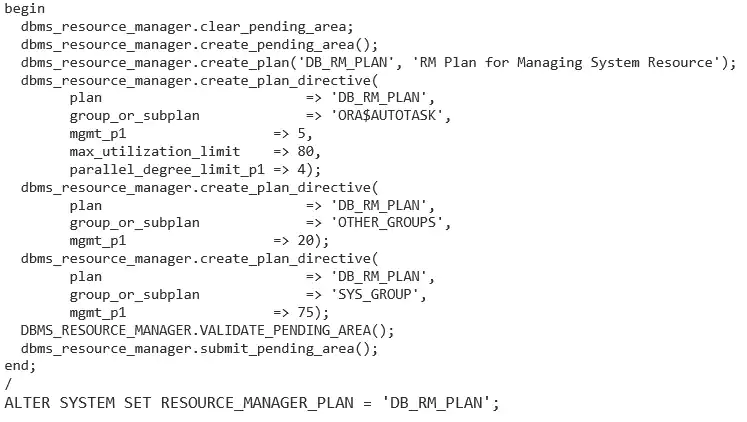
为了完整起见,上面的示例包括DEFAULT_MAINTENCE_plan的所有指令,但只需指定你需要修改的计划指令。默认情况下,当维护窗口打开时,它将激活DEFAULT_MAINTENCE_PLAN。如果您愿意,您可以创建自己的资源管理计划,并将其与你选择的任何维护窗口相关联。如果还设置了resource_management_plan初始化参数,则在批处理窗口同时打开和关闭时,可以使用相同的资源管理计划。下面是一个示例:
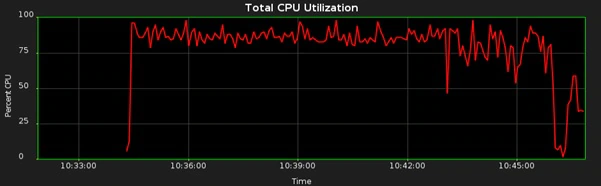
当AUTO_DGREE使用时,会看到完全不同的资源使用率。在本例中,这些表都是相同的,以便有正常的表现:

现在,我们使用了更多的CPU,并且接下来该任务仅用了12分26秒就完成了(而在前边,它使用20分钟的窗口是不成完成的):

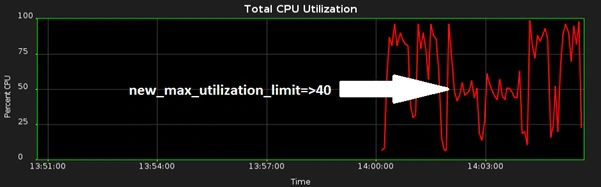
请记得,在批处理窗口期间,数据库资源管理是强制打开的,所以,即便是在任务运行期间,也是可以非常容易去调整CPU使用率的。比如,请考虑一下当我将使用率限制从80%,下调到40%并再来一次时,会发生什么:
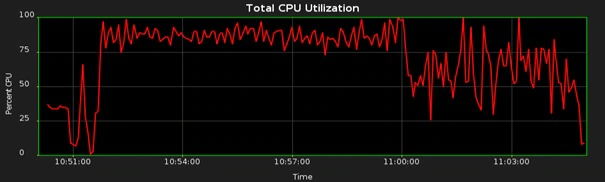
让我们看一下更真实的AUTO_DEGREE场景。在下面的例子中,我们有一个拥有大小变化很大的表的SCHEMA。CPU的使用情况目前是不太一致的:
对于每一个不同大小的表,其DOP是变化的。该任务最初以串行运行(大约25%的CPU),然后以DOP 2运行了一段时间,然后是DOP 3,最后回到的串行。我们可以基于表对DOP做微管理,但是避免类似这种方法是更好的,因为我们一贯的目标是避免过多的手动干预。全局AUTO_DEGREE方法在大部分情况下是足够好的,所以,不需要进一步的手动干预。
选项3 - 并发收集统计信息 - CONCURRENT
并行统计信息收集让我们明显增加了CPU使用率,如果我们有空闲资源并且想更快地运行呢?在前面的例子中,CPU可能会全部用满。如果你想这样,那么要如何做呢?
首先,关闭并行执行(晚些我们会改回来):
exec dbms_stats.set_global_prefs('DEGREE', 1)复制
CONCURRENT偏好参数允许DBMS_SCHEDULER一次启动多个统计信息收集任务,因此,数据库会并发的在多个表和表分区上收集统计信息。我们可以仅为自动统计信息收集启用该行为:
exec dbms_stats.set_global_prefs('CONCURRENT','AUTOMATIC')复制
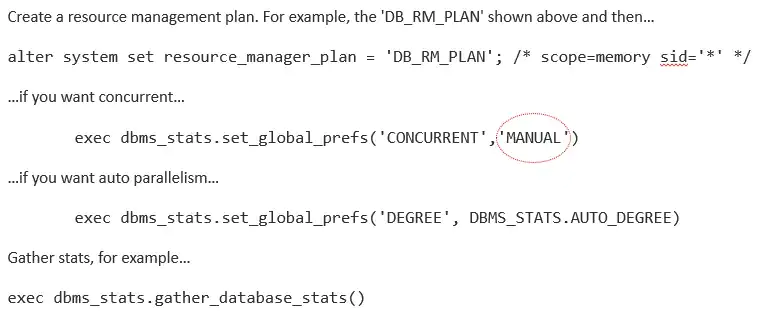
如果你启用了数据库资源管理计划,你可以为手动统计信息收集使用并发,或者手动统计信息和自动统计均使用:
exec dbms_stats.set_global_prefs('CONCURRENT','MANUAL') exec dbms_stats.set_global_prefs('CONCURRENT','ALL')复制
现在,数据库会为收集统计信息使用多个计划任务。在我的环境中,自动统计信息收集启动了16个任务进程,并且CPU的使用情况看起来是这样的:
我在使用的max_utilization_limit设置为80%,任务完成用时11分39秒:

并发统计信息收集在所有表的大小近似时会工作得非常好,但没有并行执行,串行任务在非常大的表上运行,会花费很长的时间,并可能在批处理窗口关闭前无法完成。如果这对你是个问题,你可以使用并发处理和并行执行的组合。
选项4 - 并发且并行方式收集统计信息 - CONCURRENT and AUTO_DEGREE
并发和并行执行一起实现时要小心,因为这有可能执行了大量并发的并行服务,并产生非常高的系统负载。多个任务将启动,且每一个任务潜在会启动多个并行查询服务。做为一个非常通用的经验,任何时刻你需要执行的并行服务都不要超过CPU核数的2到4倍。
你可以通过以下的方法,缓解启动过多并行执行服务的风险:
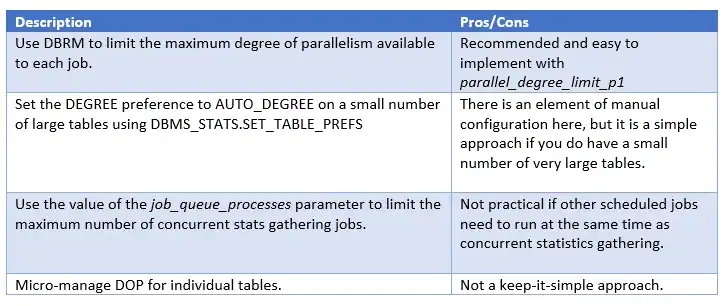
目前没有办法限制分配给并发统计信息收集的作业队列进程的数量,因此“下调”job_queue_processes设置是唯一的方法。我已针对此限制创建了一个增强请求。
允许自动统计信息收集任务使用并发:
exec dbms_stats.set_global_prefs('CONCURRENT','AUTOMATIC')复制
设置全局性的AUTO_DEGREE:
exec dbms_stats.set_global_prefs('DEGREE', DBMS_STATS.AUTO_DEGREE)复制
或者,针对特定的大表:
exec dbms_stats.set_table_prefs(user, 'BIG_TABLE', 'DEGREE', DBMS_STATS.AUTO_DEGREE)复制
在我的系统上,自动统计信息收集任务会启动16个任务进程,我所使用的资源管理计划限定DOP为4. 其结果是同时会有64个并行执行服务运行,这样看来,在我的环境中将DOP限定为2应该是更好的选择。以下是新的CPU使用情况:
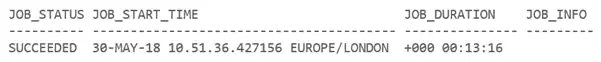
任务用时13分16秒完成:
在本例中,为何使用CONCURRENT和AUTO_DEGREE并没有在运行时间上受益呢?这是因为不使用AUTO_DEGREE的CONCURRENT消耗CPU的上限已经被DBRM限定到了80%。在更常见的,有各种混合的大小表,一部分非常大的表和更快的IO子系统的情况下,那么AUTO_DEGREE与CONCURRENT一起使用,潜在会产生最短的统计信息收集时间。
如果为了限制并发执行的任务数,你可以减少job_queue_processes的值,那么你应该增加DOP的限制到更高的值:

这对于仅有很少的表启用了并行度的情况,也是适用的。
Oracle 多租户
撰写本文时,在多租户数据库中使用CONCURRENT来并行收集统计信息时有一个BUG(bug#27249531)。由收集统计信息启动的并行执行服务并不受max_utilization_limit的控制。这会导致高CPU开销的结果 。如果不使用CONCURRENT,DEGREE超过1或者使用AUTO_DEGREE都是正常的。
该BUG目前被标识为已经在19.1中修复。如果你的版本或平台无此补丁,则最好的解决方案是使用DEGREE=>1,如果你想在多租户环境中使用CONCURRENT的话。
手动统计信息收集
如果你想启动手动统计信息收集,并且继续完整使用并行和并发设置,那么你可以使用如下方法:
性能比较
以上的示例使用了一个小型的测试系统,因此,观察一个企业级的系统(比如带有超线程的72核CPU)会是什么表现是非常有用的。Oracle的真实世界性能团队运行了一些测试,来检测不同的技巧。
统计信息收集方法的相关性能在你测试的每一个系统上都会是不同的,因此,我们要把它看做是艺术,而不是科学。比如,测试表全都是大表而且大小相同,那么,这会更适合AUTO_DEGREE(不使用CONCURRENT),因为每个表可以有更高的并行度。
大量的CPU核数会让默认的方法看起来罕见地能量不足。在本例中,CPU仅有1.5%的使用率;企业级系统中的单核CPU:
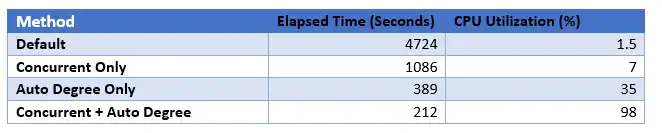
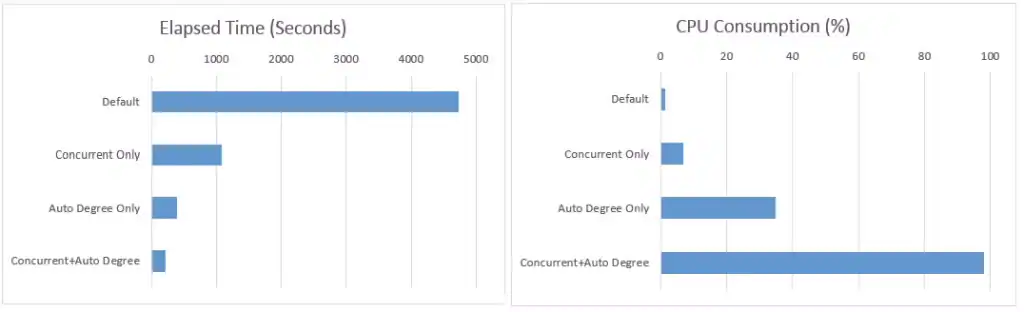
这是绘制的结果图:
总结
请记住,为了从本文列出的技巧中获得好处,你需要空闲的机器资源。
一般来说,如果你有很多的大表,选项2最有可能让你快速和轻松的获胜。如果你有大量空闲的机器资源和大量的小表,选项3是最棒的。
选项4需要更加小心,避免启动过多的并行执行服务。
如果你需要非常快速地完成一次统计信息收集,选项3和选项4都是特别有用的:也许你正在完成一个新的部署或在升级后进行统计信息收集。
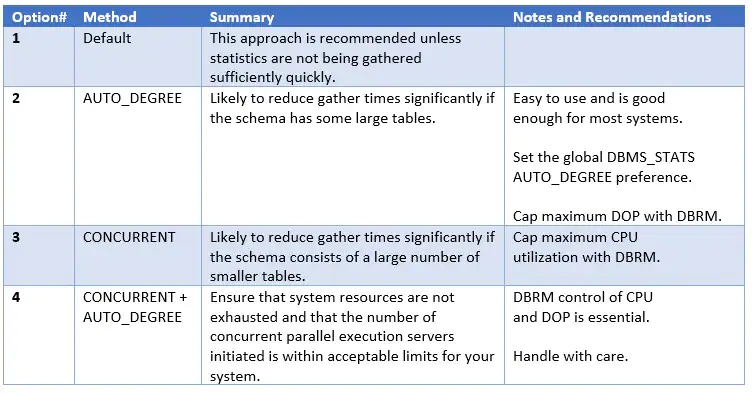
高维度的总结:
我已上传自包含的测试脚本到 GitHub.
欢迎评论!
原文链接:https://blogs.oracle.com/optimizer/post/how-to-gather-optimizer-statistics-fast
How to Gather Optimizer Statistics Fast!
January 1, 2020 | 13 minute read
Nigel Bayliss
Product Manager
There are a number of ways to speed up the process of gathering optimizer statistics, but I’m not sure that it’s common knowledge just how much of an effect some simple changes can make. If you have been asking yourself, “why is stats gathering taking so long and what can I do about it?”, then this post is for you.
If you are already familiar with the different methods of gathering optimizer statistics, you might want to jump to the end of this post where I compare them and make some recommendations.
Overview
The perception that it’s difficult to speed up statistics gathering has sometimes motivated DBAs to manipulate the number of rows sampled on a table-by-table basis using the ESTIMATE_PERCENT parameter (or DBMS_STATS preference). For example, large tables may have estimate percent set to 1% and small tables, 100%. Legacy scripts play their part too: some systems are still using procedures established before the performance enhancements available with auto sample size. One of the reasons we recommend ESTIMATE_PERCENT=>AUTO_SAMPLE_SIZE is that it includes number of distinct value (NDV) optimizations that yield high performance and accurate statistics. Gathering statistics using a 1% sample of rows might complete very quickly, but inaccurate statistics are the likely result, along with sub-optimal SQL execution plans.
Instead of manipulating ESTIMATE_PERCENT, the time taken to gather statistics can be reduced by using more machine resources. This post compares some before-and-after scenarios to demonstrate how you can do this. Fully worked examples are available in GitHub.
I will concentrate on using automatic optimizer statistics gathering, but the lessons are broadly applicable to manual statistics gathering too (there’s an example at the end of the post). The examples are intended for use on Oracle Database 12c and Oracle Database 18c. The same techniques are applicable to Oracle Database 11g, but note that the resource consumer groups have different names in that release.
Option #1 - Default Statistics Gathering
Consider the following trace of CPU consumption over time:
It shows my CPU utilization while the automatic statistics gathering job is running and there’s not much else happening on the system. Notice that about 75% of the CPU is not utilized. This fact is easy to understand once you know that the environment has a 4-core CPU with one thread per core. By default, statistics gathering uses a single process (with a single worker-thread) and this will utilize the processing power of a single CPU core. In my case, this equates to a utilization of 25% (one quarter of the 4-core chip). For systems with a higher core count, the single process will utilize an even smaller proportion of the available CPU.
Gathering statistics like this is not necessarily a problem. If stats gathering runs to completion most nights and there’s no urgent need to have fresh statistics by a certain time, then there’s no need to do anything more. Always keep things as simple as possible and only make changes if you need to. If your environment is large and/or volatile, the auto statistics job might regularly fail to run to completion in the batch window. In other words, the window might close before all tables considered stale have fresh statistics. If this is the case, then some tables might remain stale for a long time.
Fortunately, this situation is easy to see. If you view the statistics advisor report available in Oracle Database 12c Release 2, then it will tell you. The data dictionary stored this information too. In the example below, my batch window is 20 minutes long and the auto stats job has sometimes failed to complete (status STOPPED). The JOB_INFO column reveals the reason: auto statistics collection is occasionally taking longer than 20 minutes and terminates when the batch window closes.
How can we fix this? We could (a) make the batch window longer and/or (b) speed up statistics gathering. I am going to consider option b (because option a is less interesting).
How do you speed up statistics gathering? If you have resources on your database server, then you could dedicate more of it to gather statistics. You can reduce the elapsed time of gathering statistics at the cost of a more fully utilized database server. It is of course necessary to identify a window of time where there’s spare system resource, so this solution requires that the system is not running at 100% all of the time.
It is worth noting that other techniques are available to reduce the time required to maintain statistics (such as incremental statistics maintenance), but this is out of scope for the purposes of this blog post.
Option #2 - Gathering Statistics in Parallel – AUTO_DEGREE
Gathering statistics with auto sample size initiates full table scans to inspect table data. We can leverage parallel execution to make these scans complete in less time. To do this you can, for example, identify large tables and define a specific degree of parallelism (DOP):
exec dbms_stats.set_table_prefs(user, 'BIG_TABLE', 'DEGREE', 16)复制
There is an easier, set-and-forget approach where you can let Oracle to decide on the DOP for you:
exec dbms_stats.set_table_prefs(user, 'BIG_TABLE', 'DEGREE', DBMS_STATS.AUTO_DEGREE)复制
A clean and simple approach is to set the property at the global level:
exec dbms_stats.set_global_prefs('DEGREE', DBMS_STATS.AUTO_DEGREE)复制
With parallel execution in play, statistics gathering has the potential to consume lots of system resource, so you need to consider how to control this. When the auto stats gathering job executes it (by default) uses the resource management plan DEFAULT_MAINTENANCE_PLAN and a consumer group called ORA$AUTOTASK. This makes it very easy to make some adjustments and control just how much resource you want to dedicate to gathering statistics.
You first need to decide what priority to attribute to auto stats gathering depending on what other processes are likely to be running at the same time. In the following example, the auto stats job has a minimum of 5% CPU if other tasks running in the database are competing for CPU. However, if the system is not busy, we will allow the job to consume up to 80% of the CPU (this will protect processes that must run outside the control of the database). The maximum degree of parallelism an individual session can use is four in this case. It is useful to control the maximum DOP because you will want to make sure that you do not reach the maximum number of parallel server processes allowed for the system (this will become more relevant later in this post).
For completeness, the example above includes all plan directives for the DEFAULT_MAINTENANCE_PLAN, but it is only necessary to specify the plan directives you want to modify. By default, when the maintenance windows opens, it will activate the DEFAULT_MAINTENANCE_PLAN. If you prefer, you can create your own resource management plan and associate it with any maintenance windows of your choosing. If you also set the resource_management_plan initialization parameter, then you can use the same resource management plan when the batch windows are both open and closed. Here’s an example:
When AUTO_DEGREE is used the resource utilization can look very different . In this example, the tables are all identical so there’s a very regular pattern:
We are now using much more CPU, and consequently the job completes in only 12 minutes and 26 seconds (where, previously, it failed to complete within the 20-minute window):
Remember that database resource management (DBRM) is in force during the batch window, so it is very easy to adjust CPU utilization even while the job is running. For example - consider what happens when I adjust the utilization limit down from 80% to 40% and then back again:
Let’s look at a more realistic AUTO_DEGREE scenario. In the following example we have a schema containing tables that have a wide variation in size. The CPU profile is now less consistent:
The DOP is changing in response to the size of each individual table. The job runs serially at first (about 25% CPU), then DOP 2 for a while, then DOP 3 and then back to serial. We could micro-manage DOP on a table-by-table basis, but it is much better to avoid approaches like this because we should always aim to avoid too much manual intervention. The global AUTO_DEGREE solution will be good enough in many cases, so there will be no need for any further manual intervention.
Option #3 - Gathering Statistics Concurrently - CONCURRENT
Parallel statistics gathering has enabled us to increase CPU utilization significantly, but what if we have spare machine resources and want to go even faster? In the previous example, the CPU could be more fully utilized. If you want to achieve that, then how do you go about it?
Firstly, disable parallel execution (we will come back to that later):
exec dbms_stats.set_global_prefs('DEGREE', 1)复制
The CONCURRENT preference allows DBMS_SCHEDULER to initiate multiple statistics gathering jobs at once, so that the database will gather statistics on multiple tables and partitions concurrently. We can choose to enable this behavior for auto stats gathering only:
exec dbms_stats.set_global_prefs('CONCURRENT','AUTOMATIC')复制
If you enable a database resource management plan, you can use concurrent for manual stats or for manual and auto:
exec dbms_stats.set_global_prefs('CONCURRENT','MANUAL') exec dbms_stats.set_global_prefs('CONCURRENT','ALL')复制
The database will now gather statistics using multiple scheduler jobs. In my case, auto stats initiated 16 job processes and the CPU profile looked like this:
I am using max_utilization_limit set to 80%, and the job completes in 11 minutes and 39 seconds:
Concurrent statistics gathering works very well if tables are of a similar size, but without parallel execution, serial jobs running on very large tables can take a long time and the might not complete before the batch window closes. If this is a problem for you, you can use a combination of concurrent processing and parallel execution.
Option #4 - Gathering Statistics Concurrently and in Parallel - CONCURRENT and AUTO_DEGREE
Care is required when implementing concurrency and parallel execution because there’s scope to execute a very large number of concurrent parallel execution servers and generate a very high system load. Multiple jobs will start and each has the potential to initiate a number of parallel query servers. As a very general rule of thumb, you want to have no more than about 2CPUCoreCount to 4CPUCoreCount parallel servers executing at any one time.
You can mitigate the risk of initiating too many parallel execution servers as follows:
There is currently no way to cap the number of job queue processes allocated to concurrent stats gathering, so ‘turning down’ the job_queue_processes setting is the only way to do this. I have created an enhancement request with respect to this limitation.
Enable concurrent stats gathering for the automatic statistics gathering job:
exec dbms_stats.set_global_prefs('CONCURRENT','AUTOMATIC')复制
Set AUTO_DEGREE globally:
exec dbms_stats.set_global_prefs('DEGREE', DBMS_STATS.AUTO_DEGREE)复制
Or, for individual large tables:
exec dbms_stats.set_table_prefs(user, 'BIG_TABLE', 'DEGREE', DBMS_STATS.AUTO_DEGREE)复制
On my system, the auto stats initiated 16 job processes and the resource management plan I used limited DOP to four. This resulted in 64 parallel execution servers executing concurrently, so a DOP limited to two might have been a better choice in my case. Here is the new CPU profile:
The job completed in 13 minutes 16 seconds:
In this case, why was there no benefit in run time using CONCURRENT and AUTO_DEGREE? It is because CONCURRENT without AUTO_DEGREE consumed CPU up to the 80% limit imposed by DBRM. In the more general case where there is a good mix of table sizes, some very large tables and a faster IO subsystem, then AUTO_DEGREE used in combination with CONCURRENT has the potential to yield the shortest gather stats times.
If you are in a position to be able to decrease job_queue_processes to limit the number of jobs that execute concurrently, then you will be able to increase the DOP limit to a higher values:
The same is true if there are only a small number of tables where parallelism is used.
Oracle Multitenant
At the time of writing, there was a bug with parallel statistics gathering in a multitenant database when used with CONCURRENT (bug# 27249531). Parallel execution servers initiated by gather stats are not constrained by max_utilization_limit. This can result in high CPU consumption. Using DEGREE above 1 or AUTO_DEGREE is OK if CONCURRENT is not used.
The bug is now marked fixed in 19.1. If your version or platform does not have this patch, the best solution is to use DEGREE=>1 if you want to use CONCURRENT in multitenant environments.
Manual Statistics Gathering
If you want to initiate stats gathering manually, and still make full use of parallel and concurrent settings, then you can use the following approach:
Performance Comparisons
A small test system was used for the examples above, so it will be useful to see what an enterprise-class system looks like (let’s say 72 cores with HT). The Oracle Real World Performance Group ran some tests to check out the different techniques.
The relative performance of the stats gathering methods will be different on every system you try, so treat this as entertainment rather than science. For example, the test tables were all large and all the same size, so this will work in favor of AUTO_DEGREE (used without CONCURRENT) because a high degree of parallism was used for every table.
A large number of CPU cores will make the default method look exceptionally underpowered. In this case the CPU is only 1.5% utilized; a single core in an enterprise-class system:
Here are the results plotted:
Summary
Remember that you will need spare machine capacity to gain benefit from the techniques outlined in this blog post.
Generally speaking, option #2 is most likely to give you a quick and easy win if there are a number of very large tables. Option #3 is great if you have plenty of spare machine resource and a large number of smaller tables.
Option #4 requires more care to avoid initiating too many parallel execution servers.
Options #3 and #4 are particularly useful if you need to get a one-off stats gathering task done very quickly: perhaps when you are commissioning a new deployment or gathering statistics after an upgrade.
Here’s a high-level summary:
I’ve uploaded self-contained test scripts to GitHub.
Comments welcome!


