真实世界中的数据,对于同一张表中存储的不同列之间的数据,通常是有关系或是相关的。比如,考虑一张客户表,其中的cust_state_province(省份信息)列中的值就会受country_id(国家)列中值的影响,因为加利福尼亚州只能在美国中找到。如果Oracle优化器意识不到真实世界中的这些关系,那么同一张表中的多个列,出现在WHERE子句中的话,它是有可能错误评估其基数的。使用扩展统计信息,你可以有机会告诉优化器在真实世界中这些列之间的关系。
通过在一组列上创建扩展统计信息,当这组列在SQL的WHERE子句中一起出现时,优化器可以更准确地评估基数。使用DBMS_STATS.CREATE_EXTENDED_STATS来定义你希望做为整体来收集统计信息的列组。一旦组被建立,当表上的统计信息被收集时,Oracle会自动维护这些列组上的统计信息。
如果我们继续一开始在客户表上的例子,当cust_state_province列中的值是’CA’时,我们就会知道country_id的值会是52790或USA。这两个列上的数据也会是倾斜的;因为SH(译者注:Oracle样例库的SCHEMA名,前文提及的客户表即是SH下的表)中用到的公司位于旧金山,所以,表中的大多数行的值是’CA’和52790。列之间的关系,以及数据的倾斜,使得当这些列在查询中被一起使用时,优化器评估这些列的基数是困难的

仅有基础的统计信息时,我们看到优化器认为仅有127行记录会被返回。因为它假设这两列都会减少返回的行数(表中的行数* 1/列1的唯一值数量 *1/列2的唯一值数量)。我们知道,在这个案例中这是不对的。我们必面提供更好的统计信息给优化器,以便其可以确定正确的评估基数。在Oracle Database 11g之前,为我们打开的唯一选项是让优化器意识到,数据在Country_id列(绝大多数行以52790为值)和cust_state_province列(绝大多数的行以’CA’为值)上是倾斜的。我们可以通过在倾斜列上收集直方图来做到。
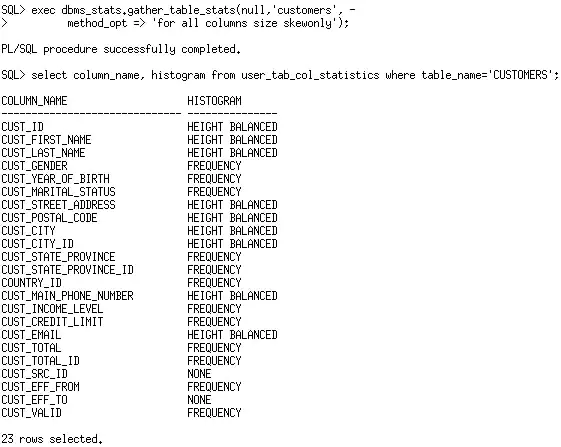
现在,我们在country_id和cust_state_province这两个列上有了直方图,让我们来看一下优化器是否会评估得更准确了。
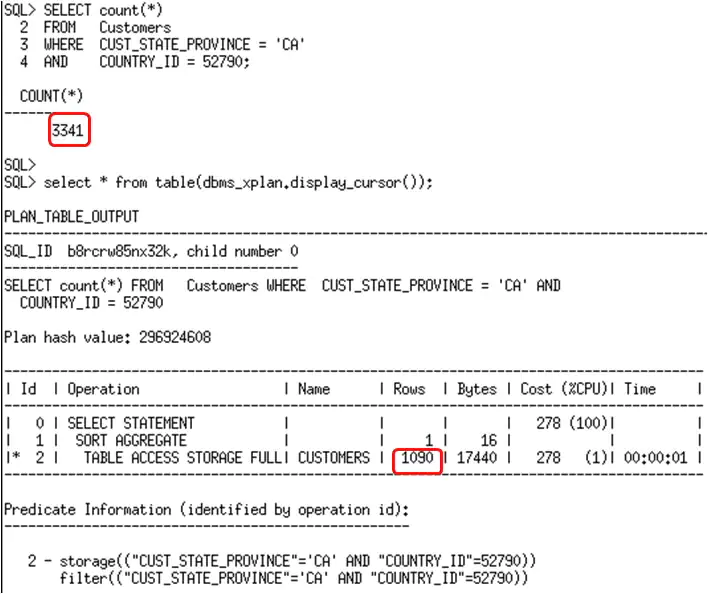
由于我们在各自的列上有了直方图,评估上有了些许的改进。然而,优化器依然不能意识到这两个列上存在关系和相关性。我们可以通过将这两列做为一组,创建扩展统计信息,来告诉优化器这种相关性。一旦扩展统计信息被创建,下次在客户表上收集统计信息时,针对country_id 和cust_state_province列的组合的额外的统计信息被收集。DBMS_STATS.CREATE_EXTENDED_STATS函数可以被用于创建扩展统计信息,把country_id 和cust_state_province列做为列组。

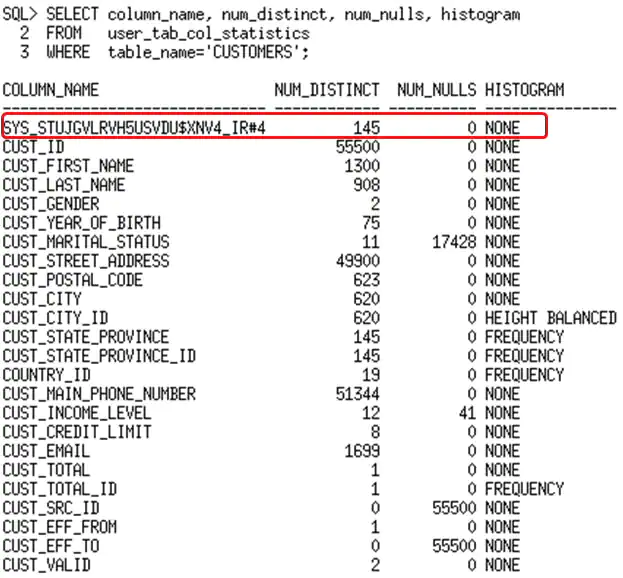
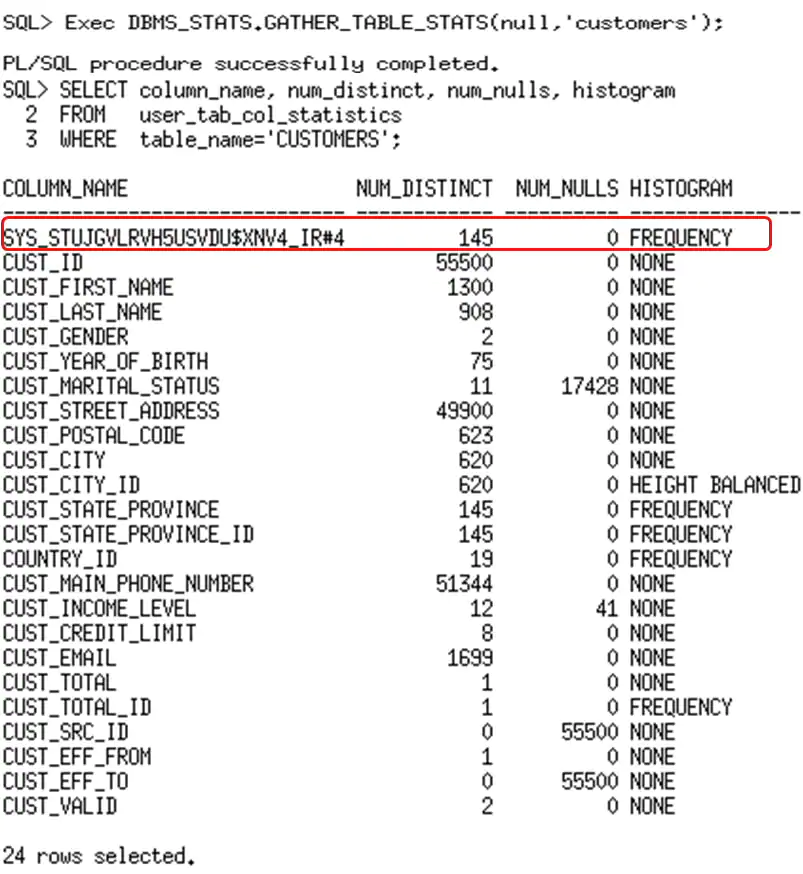
在创建了扩展统计信息并重新收集统计信息后,你会发现在USER_TAB_COL_STATISTICS中系统生成了一个列名,来表示新的列组。为列组维护的统计信息包括:
- 唯一值数量
- NULL值数量
- 直方图
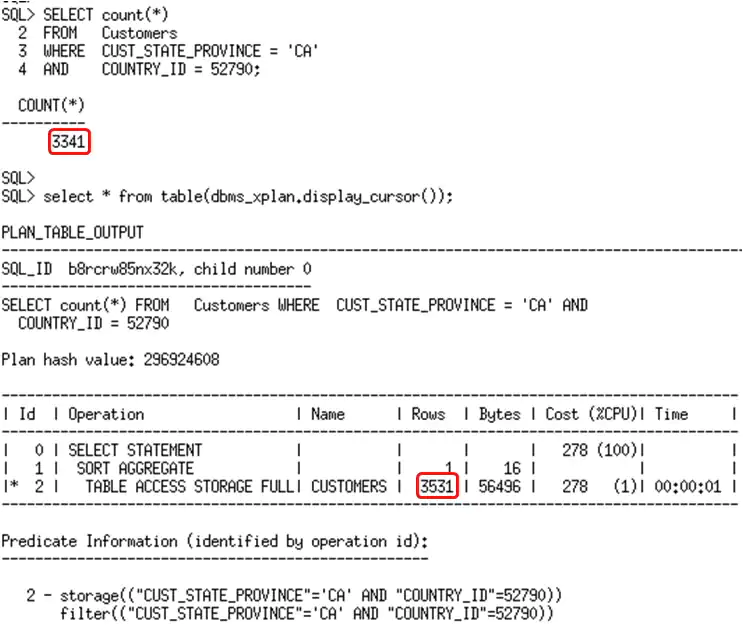
因此,我们现在在列组上有了统计信息,让我们确认一下这对于优化器得到正确的评估是否足够了。
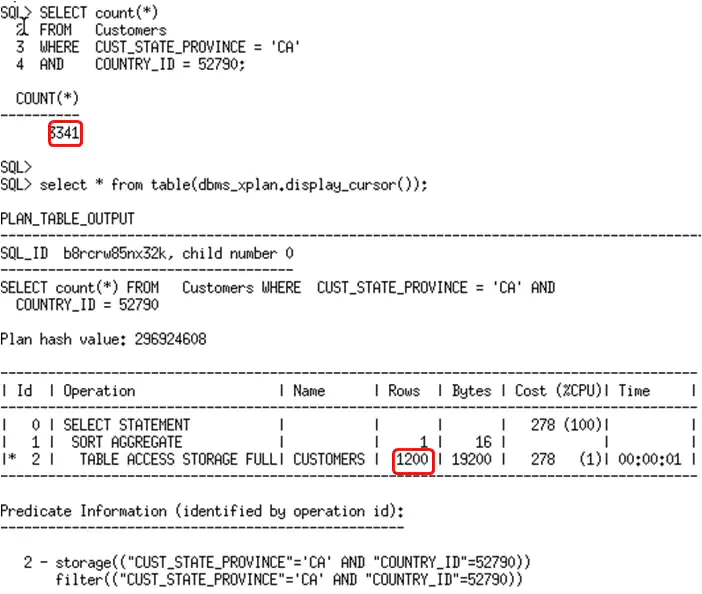
评估的基数仍然不正确,在本例中,为何扩展统计信息没有帮助呢?这里实际上没有使用扩展统计信息。如果你回过去看USER_TAB_COL_STATISTICS 的输出,你可以看到在country_id和cust_state_province列上有直方图建立。但是,在列组上是没有直方图建立的。由于直方图提供给优化器的信息比标准统计信息更多,优化器忽略了扩展统计信息,而是使用了各自列上的统计信息。
由于我们又一次执行了查询,优化器会记录下来,在创建的扩展上的直方图对于查询是有益的。当下一次在表上收集统计信息时,直方图会自动在列组上创建。
使用列组上的直方图,优化器现在就可以使用扩展统计信息并准确地评估基数了。
如果我们的列组仅仅是语句中谓词的子集时,扩展统计信息也是可以被使用的。假设有一个在(c1,c2)上创建的列组,SQL语句的WHERE子句中包括 c1=1 and c2=1 and c3=1. 优化器会使用c1,c2上的扩展统计信息,并乘以第三个谓词的选择率。它会使用列组上的所有可用统计信息,包括直方图。如果查询中只出现了列组中的一部分,优化器仍可以使用扩展统计信息(以受限的方式)。
原文链接:https://blogs.oracle.com/optimizer/post/extended-statistics
Extended Statistics
January 1, 2020 | 5 minute read
Maria Colgan
Distinguished Product Manager
In real-world data, there is often a relationship or correlation between the data stored in different columns of the same table. For example, consider a customers table where the values in a cust_state_province column are influenced by the values in a country_id column, because the state of California is only going to be found in the United States. If the Oracle Optimizer is not aware of these real-world relationships, it could potentially miscalculate the cardinality estimate if multiple columns from the same table are used in the where clause of a statement. With extended statistics you have an opportunity to tell the optimizer about these real-world relationships between the columns.
By creating extended statistics on a group of columns, the optimizer can determine a more accurate cardinality estimate when the columns are used together in a where clause of a SQL statement.You can use DBMS_STATS.CREATE_EXTENDED_STATS to define the column group you want to have statistics gathered on as a whole. Once the group has been established Oracle will automatically maintain the statistics on that column group when statistics are gathered on the table.
If we continue with the initial example of the customers table, When the value of cust_state_province is ‘CA’ we know the value of country_id will be 52790 or the USA. There is also a skew in the data in these two columns; because the company used in the SH is based in San Francisco so the majority of rows in the table have the values ‘CA’ and 52790. Both the relationship between the columns and the skew in the data can make it difficult for the optimizer to calculate the cardinality of these columns correctly when they are used together in a query.

initial_query_and_plan.png
With just basic statistics we see the optimizer thinks there will only be 127 row returned because it assumes both columns will reduce the number of rows returned (# of rows in the table X 1/NDV of column1 X 1/NDV of column2). We know that this is not true in this case. We must provide better statistic to the optimizer so it can determine the correct cardinality estimate. Prior to Oracle Database 11g the only option open to us would be to make the optimizer aware of the data skew in both the country_id column (most rows have 52790 as the value) and the cust_state_province column (most rows have ‘CA’ as the value). We can do this by gathering histograms on the skewed columns.

histogram_stats.png
Now that we have histograms on both the country_id and the cust_state_province columns let’s see if the optimizers estimate is more accurate.

histogram_plan.png
There is a slightly improvement in the estimate since we have histograms for the individual columns. However the optimizer is still not aware that there is a relationship or correlation between these two columns. We can tell the optimizer about this correlation by creating extended statistics on these two columns as a group. Once the extended statistics have been created the next time statistics are gathered on the customers table an extra set of statistics, for the combine group of country_id and cust_state_province, will be collected. The DBMS_STATS.CREATE_EXTENDED_STATS function can be used to create the extended statistics or a ‘column group’ for country_id and cust_state_province.

create_extended_stats.png
After creating the extended statistics and regather statistics, you will see a system generated column name in USER_TAB_COL_STATISTICS, which represents the new column group. A subset of statistics are maintained for column groups including;
- Number of distinct values
- Number of Nulls
- Histograms

system_generated_stats.png
So now we have statistics on the column group lets confirm that is enough information for the optimizer to get the correct estimation.

Not_working.png
The cardinality estimate is still off. Why did the extended statistics not help in this case? The extended statistics were not actually used here. If you look back at the output from USER_TAB_COL_STATISTICS you can see there is a histogram created on the country_id and cust_state_province columns. However, there is no histogram created on the column group. Because a histogram provides the optimizer with more information than standard statistics the optimizer ignores the extended statistics and uses the individual column statistics instead.
Since we have executed the query again, the optimizer will have recorded that a histogram on the created extension is beneficial for the query. A histogram will be automatically created on the column group the next time statistics are gathered on the table

p1.png
With the histogram in place on the column group, the optimizer will now use the extended statistics and the cardinality estimates is now accurate.

working.png
Extended statistics are used even if we have them for only a subset of predicates in the statement. Lets say there is a column group created on (c1, c2) and we have a SQL statement with a where clause that contains c1 = 1 and c2 =1 and c3 = 1. The optimizer will use the extended statistics on C1,C2 and multiply that by the selectivity of third predicate. It will use all the available statistics on column group, including histograms. The optimizer will also use the extended statistics (in a limited way) if a subset of the column group is present in the query.


