


在主机运维是时常用的命令是top,需要实时监控IO情况使用iotop,监控网络情况时使用iftop,实时监控PostgreSQL数据库时可以使用pg_top,下面介绍pg_top的安装和简单使用。
安装
安装非常简单,几个命令即可
yum -y install epel-release libbsd-devel cmake git clone https://gitlab.com/pg_top/pg_top.git cd pg_top/ cmake -DCMAKE_INSTALL_PREFIX=$PGHOME && make && make install复制
使用
#查看帮助
[root@localhost ~]# pg_top --help
pg_top monitors a PostgreSQL database cluster.

Usage:
  pg_top [OPTION]... [COUNT]

General options:
  -b, --batch               use batch mode
  -c, --show-command        display command name of each process
  -C, --color-mode          turn off color mode
  -i, --interactive         use interactive mode
  -I, --hide-idle           hide idle processes
  -n, --non-interactive     use non-interactive mode
  -o, --order-field=FIELD   select sort order
  -r, --remote-mode         activate remote mode
  -R                        display replication stats
  -s, --set-delay=SECOND    set delay between screen updates
  -T, --show-tags           show color tags
  -V, --version             output version information, then exit
  -x, --set-display=COUNT   set maximum number of displays
                            exit once this number is reached
  -X                        display i/o stats
  -z, --show-username=NAME  display only processes owned by given
                            username
  -?, --help                show this help, then exit

Connection options:
  -d, --dbname=DBNAME       database to connect to
  -h, --host=HOSTNAME       database server host or socket directory
  -p, --port=PORT           database server port
  -U, --username=USERNAME   user name to connect as
  -W, --password            force password prompt, and persistent connection

#运行pg_top 2次
[root@localhost ~]# pg_top -b -x 2
last pid: 14947;  load avg:  0.26,  0.23,  0.21;       up 28+18:02:33  21:03:47
8 processes: 5 other background task(s), 2 active, 1 idle txn
CPU states:  0.5% user,  0.0% nice,  0.7% system, 98.8% idle,  0.0% iowait
Memory: 1483M used, 30G free, 0K shared, 2108K buffers, 946M cached
Swap: 0K used, 16G free, 0K cached, 0K in, 0K out

    PID USERNAME    SIZE   RES STATE   XTIME  QTIME  %CPU LOCKS COMMAND
   8415 postgres   2334M 6748K active 756:16 756:16   0.0     2 postgres: postgres postgres [local] EXPLAIN waiting
   3791 postgres   2340M   12M idltxn 763:53 763:53   0.0    11 postgres: postgres postgres [local] idle in transaction
  14948 postgres   2334M   12M active   0:00   0:00   0.0     8 postgres: postgres postgres [local] idle
  20296 postgres   2333M 2276K          0:00   0:00   0.0     0 postgres: logical replication launcher
  20292            2332M   19M          0:00   0:00   0.0     0 postgres: background writer
  20294            2333M 2780K          0:00   0:00   0.0     0 postgres: autovacuum launcher
  20291            2332M   23M          0:00   0:00   0.0     0 postgres: checkpointer
  20293            2332M   18M          0:00   0:00   0.0     0 postgres: walwriter

last pid: 15285;  load avg:  0.24,  0.23,  0.21;       up 28+18:02:38  21:03:52
8 processes: 5 other background task(s), 2 active, 1 idle txn
CPU states:  0.6% user,  0.0% nice,  1.2% system, 98.2% idle,  0.0% iowait
Memory: 1480M used, 30G free, 0K shared, 2108K buffers, 947M cached
Swap: 0K used, 16G free, 0K cached, 0K in, 0K out

    PID USERNAME    SIZE   RES STATE   XTIME  QTIME  %CPU LOCKS COMMAND
   8415 postgres   2334M 6748K active 756:21 756:21   0.0     2 postgres: postgres postgres [local] EXPLAIN waiting
  15286 postgres   2334M   12M active   0:00   0:00   0.0     8 postgres: postgres postgres [local] idle
   3791 postgres   2340M   12M idltxn 763:58 763:58   0.0    11 postgres: postgres postgres [local] idle in transaction
  20296 postgres   2333M 2276K          0:00   0:00   0.0     0 postgres: logical replication launcher
  20292            2332M   19M          0:00   0:00   0.0     0 postgres: background writer
  20294            2333M 2780K          0:00   0:00   0.0     0 postgres: autovacuum launcher
  20291            2332M   23M          0:00   0:00   0.0     0 postgres: checkpointer
  20293            2332M   18M          0:00   0:00   0.0     0 postgres: walwriter

[root@localhost ~]#
复制-
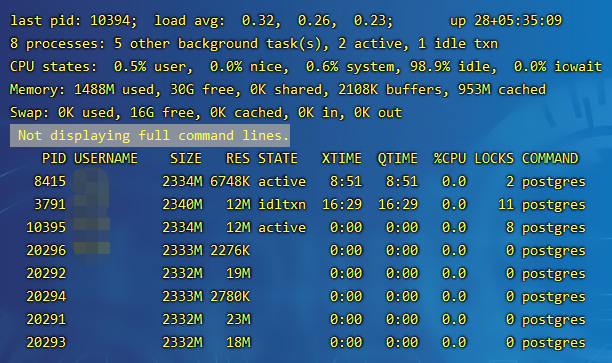
pg_top
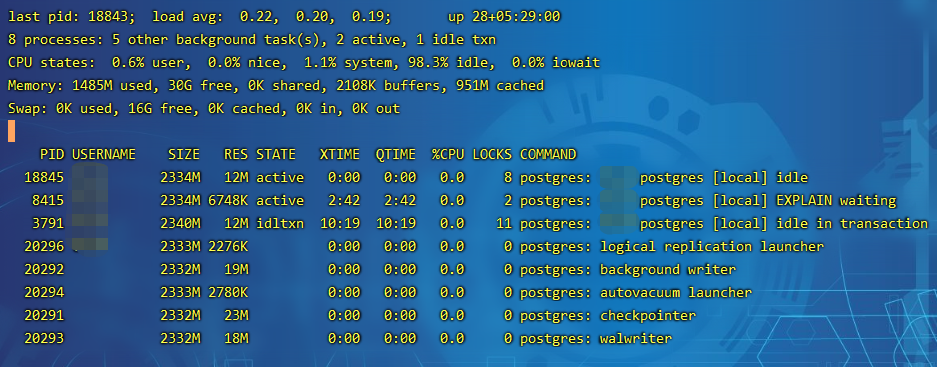
这里可以实时监控到主机的负载、CPU、内存、SWAP等信息,PG的进程数(总数、活跃数,空闲数等),同样还能显示具体的进程信息(PID、DB用户名、资源占用情况、事务时间、查询时间、锁数量和操作的动作),监控时需要特别注意主机负载情况,进程的XTIME\QTIME\LOCKS等信息。默认情况下监控是5秒刷新一次,但是可以通过-s来指定刷新的时间间隔。 -
pg_top -X

监控进程的IO情况。 -
pg_top -R
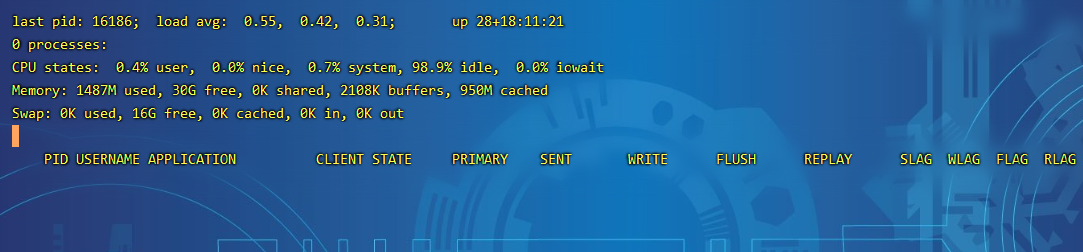
监控流复制下游节点,由于本实例没有配置备机,所以无数据。 -
pg_top -z test
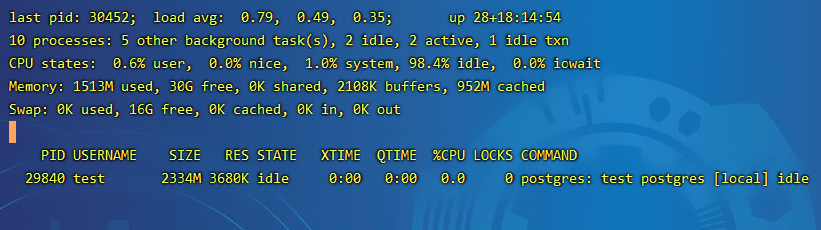
监控test用户连接数据库的会话信息。 -
pg_top -o locks
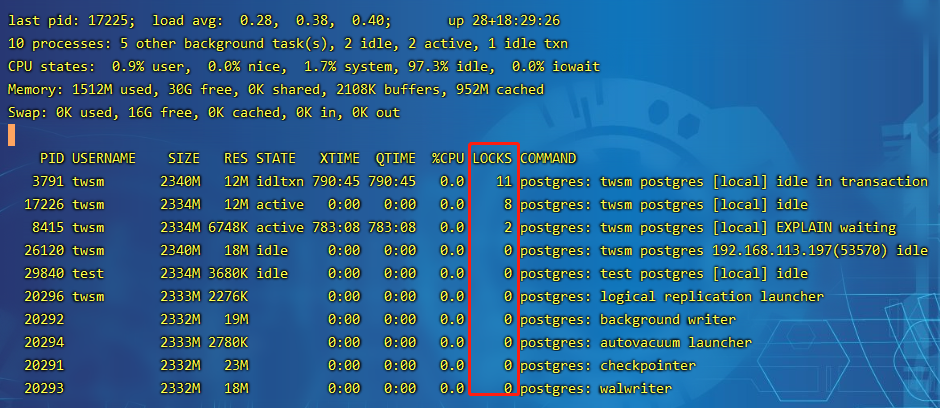
对指定的列进行排序,注意列名必须小写。

进入监控命令后,按键盘h键,会显示隐藏的指令,可以根据实际需要选择。

进入监控命令后,按键盘c键可以切换COMMAND的显示,可以显示当前进程运行的SQL语句。
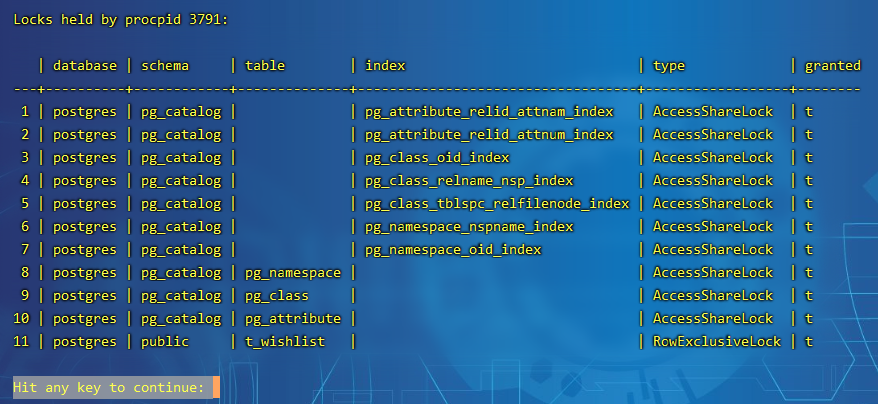
进入监控命令后,按键盘L键,然后再输入具体的PID,可以查看会话的锁情况。

进入监控命令后,按键盘Q键,然后再输入具体的PID,可以查看当前进程运行的SQL语句。
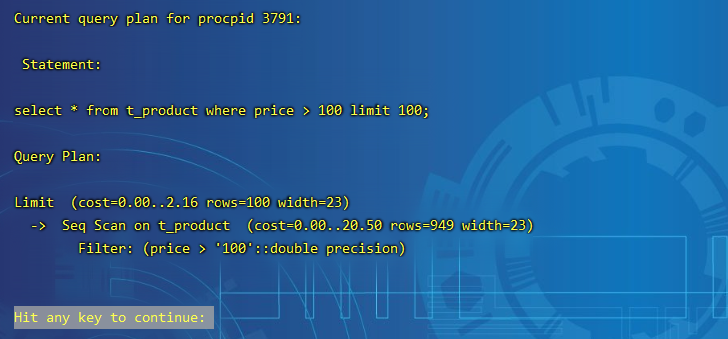

进入监控命令后,按键盘E键(EXPLAIN)或A键(EXPLAIN ANALYZE),然后再输入具体的PID,可以查看进程当前运行SQL的执行计划。
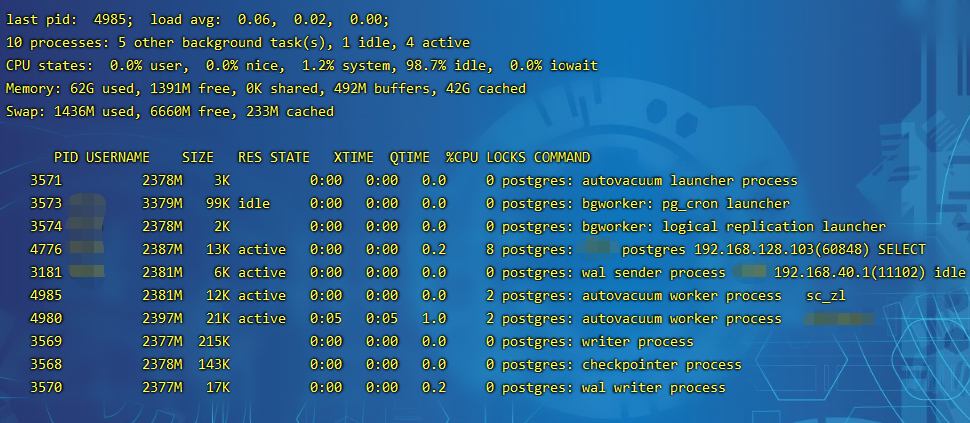
pg_top不仅支持本地监控,同时还支持远程监控,可以在命令行指定远程实例的主机、端口、用户名、数据库和-r参数,然后输入正确的密码即可,但是这里有个前提,远程实例必须先安装pg_proctab插件,因为工具是连接的远程数据库,数据库默认情况下是无法访问到主机的监控信息的,这时就需要数据库安装插件来支持获取主机信息。
#远程主机192.168.102.230安装pg_proctab插件
git clone https://gitlab.com/pg_proctab/pg_proctab.git
cd pg_proctab
make && make install
psql -c "create extension pg_proctab;"
复制- pg_top -h 192.168.102.230 -U postgres -d postgres -p 5432 -r -W
参考:
https://gitlab.com/pg_top/pg_top
https://github.com/markwkm/pg_proctab
评论

 0 点赞
0 点赞 0 点赞
0 点赞


