
数据库为oracle11g, 配置8U32G.
我有一张订单表order,总数据5kw. 按天分区, 每天大概10w~20w.
order{
id varchar(32)// 订单号,8位日期+随机数, 建本地分区索引,唯一, ORDER_UK_ID
mno varchar(12) //商户号, 建本地分区索引,非唯一, IDX_MNO_LOCAL
part as to_number(substr(id,1,8)) //虚列, 分区列, 截id的前8位日期.
........其它大约20个字段.
}
同时建全局索引IDX_PART_MNO(part,mno), 测试时根据需要开启.
以下是查询大商户m111111和小商户m222222一周的交易量的查询计划:
#########################################
使用全局索引(part,mno):
#########################################
select count(MNO) from ORDER t where t.part between 20210202 and 20210209 and t.MNO='m1' ;
COUNT(MNO)
-------------------
54040
--------------------------------------------------------------------------------------
| Id | Operation | Name | Rows | Bytes | Cost (%CPU)| Time |
--------------------------------------------------------------------------------------
| 0 | SELECT STATEMENT | | 1 | 16 | 558 (1)| 00:00:07 |
| 1 | SORT AGGREGATE | | 1 | 16 | | |
|* 2 | INDEX RANGE SCAN| IDX_PART_MNO | 83306 | 1301K| 558 (1)| 00:00:07 |
--------------------------------------------------------------------------------------
Predicate Information (identified by operation id):
---------------------------------------------------
2 - access("T"."PART">=20210202 AND "T"."MNO"='m1' AND
"T"."PART"<=20210209)
filter("T"."MNO"='m1')
Statistics
----------------------------------------------------------
0 recursive calls
0 db block gets
865 consistent gets
0 physical reads
0 redo size
539 bytes sent via SQL*Net to client
520 bytes received via SQL*Net from client
2 SQL*Net roundtrips to/from client
0 sorts (memory)
0 sorts (disk)
1 rows processed
>>>>>>>>>>>>>>>select count(MNO) from ORDER t where t.part between 20210202 and 20210209 and t.MNO='m2' ;
COUNT(MNO)
-------------------
2141
--------------------------------------------------------------------------------------
| Id | Operation | Name | Rows | Bytes | Cost (%CPU)| Time |
--------------------------------------------------------------------------------------
| 0 | SELECT STATEMENT | | 1 | 16 | 558 (1)| 00:00:07 |
| 1 | SORT AGGREGATE | | 1 | 16 | | |
|* 2 | INDEX RANGE SCAN| IDX_PART_MNO | 8 | 128 | 558 (1)| 00:00:07 |
--------------------------------------------------------------------------------------
Predicate Information (identified by operation id):
---------------------------------------------------
2 - access("T"."PART">=20210202 AND "T"."MNO"='m2' AND
"T"."PART"<=20210209)
filter("T"."MNO"='m2')
Statistics
----------------------------------------------------------
8 recursive calls
0 db block gets
854 consistent gets
2 physical reads
0 redo size
538 bytes sent via SQL*Net to client
520 bytes received via SQL*Net from client
2 SQL*Net roundtrips to/from client
0 sorts (memory)
0 sorts (disk)
1 rows processed
#########################################
使用本地分区索引(part,mno):
#########################################
>>>>>>>>>>>>>>>select count(MNO) from ORDER t where t.part between 20210202 and 20210209 and t.MNO='m1' ;
COUNT(MNO)
-------------------
54040
-----------------------------------------------------------------------------------------------------------------
| Id | Operation | Name | Rows | Bytes | Cost (%CPU)| Time | Pstart| Pstop |
-----------------------------------------------------------------------------------------------------------------
| 0 | SELECT STATEMENT | | 1 | 16 | 7368 (1)| 00:01:29 | | |
| 1 | SORT AGGREGATE | | 1 | 16 | | | | |
| 2 | PARTITION RANGE ITERATOR| | 83306 | 1301K| 7368 (1)| 00:01:29 | 19792 | 19799 |
|* 3 | TABLE ACCESS FULL | ORDER | 83306 | 1301K| 7368 (1)| 00:01:29 | 19792 | 19799 |
-----------------------------------------------------------------------------------------------------------------
Predicate Information (identified by operation id):
---------------------------------------------------
3 - filter("T"."MNO"='m1' AND "T"."PART">=20210202 AND "T"."PART"<=20210209)
Statistics
----------------------------------------------------------
147 recursive calls
0 db block gets
20581 consistent gets
18337 physical reads
0 redo size
539 bytes sent via SQL*Net to client
520 bytes received via SQL*Net from client
2 SQL*Net roundtrips to/from client
6 sorts (memory)
0 sorts (disk)
1 rows processed
>>>>>>>>>>>>>>>select count(MNO) from ORDER t where t.part between 20210202 and 20210209 and t.MNO='m2' ;
COUNT(MNO)
-------------------
2141
---------------------------------------------------------------------------------------------------------------------------
| Id | Operation | Name | Rows | Bytes | Cost (%CPU)| Time | Pstart| Pstop |
---------------------------------------------------------------------------------------------------------------------------
| 0 | SELECT STATEMENT | | 1 | 16 | 947 (0)| 00:00:12 | | |
| 1 | SORT AGGREGATE | | 1 | 16 | | | | |
| 2 | PARTITION RANGE ITERATOR | | 8 | 128 | 947 (0)| 00:00:12 | 19792 | 19799 |
|* 3 | TABLE ACCESS BY LOCAL INDEX ROWID| ORDER | 8 | 128 | 947 (0)| 00:00:12 | 19792 | 19799 |
|* 4 | INDEX RANGE SCAN | IDX_MNO_LOCAL | 1595 | | 9 (0)| 00:00:01 | 19792 | 19799 |
---------------------------------------------------------------------------------------------------------------------------
Predicate Information (identified by operation id):
---------------------------------------------------
3 - filter("T"."PART">=20210202 AND "T"."PART"<=20210209)
4 - access("T"."MNO"='m2')
Statistics
----------------------------------------------------------
8 recursive calls
0 db block gets
2033 consistent gets
797 physical reads
0 redo size
538 bytes sent via SQL*Net to client
520 bytes received via SQL*Net from client
2 SQL*Net roundtrips to/from client
0 sorts (memory)
0 sorts (disk)
1 rows processed
结论:
大商户m1 小商户m2
全局索引 快 快
本地分区索引 慢,全表扫描 快,但慢于全局索引
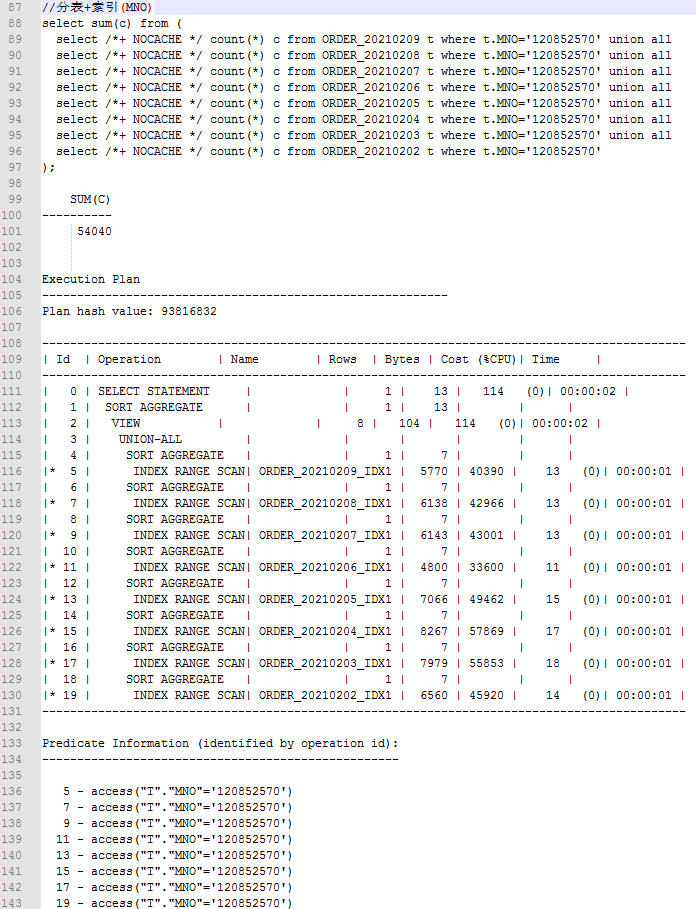
按照我的理解:分区+本地分区索引==分表+索引.
因此使用全局索引查询的耗时应只是略优于本地分区索引.
但实际执行的时候,查询大商户m1走了全表扫描,产生了很多逻辑读和物理读.
而如果建全局索引(part,merchantNo)后,上述两个查询都比较快.
在下百思不得其解, 想请教各位Oracle大神:
1. 为什么使用本地分区索引的时候要走全表扫描?而全局索引不会.
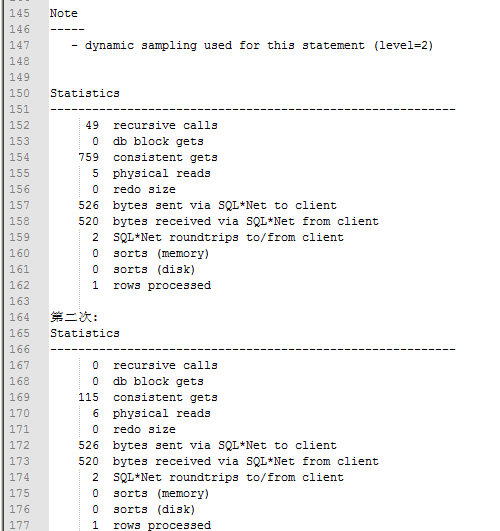
2. 为什么本地分区索引产生了这么多consistent get和physical reads?
3. 分区建分区索引和分表建索引是否一回事?能否从原理上解释一下.
4. 怎样优化本地分区索引查询到像分表一样高效?
 评论
评论