
1、等待事件中前几位的是
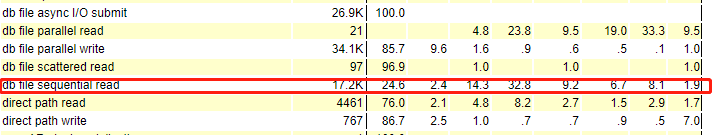
db file sequential read 7,861 4690.7 597 29.0 User I/O
enq: RO - fast object reuse 6,057 1630.5 269 10.1 Application
enq: CR - block range reuse ckpt 2,510 1516.9 604 9.4 Other
2、根据逻辑分析应该是SQL缺少索引导致的,但是根本的原因没有找到。因为之前也是存在这些问题的,但是没有接到反馈特别慢。
3、附几个时间段的awr

 评论
评论 有用 0 评论 有用 0 评论 有用 0
awrrpt_2_20881_20882.html awr中:
(1)你这io量也不大,i/o表现确实有点差,不过dbwr写效率85%都在1ms以内,写效率还可以,lgwr写效率也还可以,最慢的是单块读db file sequential read,有百分之十左右再1s左右或者大于1s,确实有点慢了。
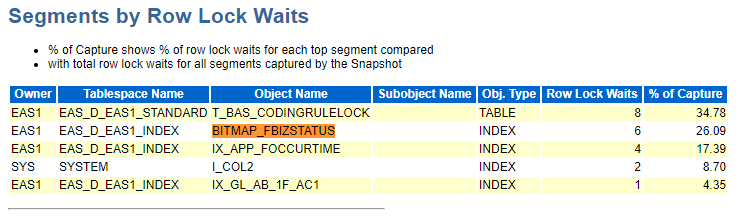
(2)另外下面行锁中有类似位图索引,这个位图索引表比例这么高,说明在进行DML,建议看看这个位图索引有没有可能换成普通索引,减少DML竞争。
(3)个人建议
根据内存建议,虽然sga设置已经达到了物理内存50%多,但是根据advisor部分,我看你的会话压力也不大,最切实可行的就是还可以调大点sga,减少物理读。
评论 有用 0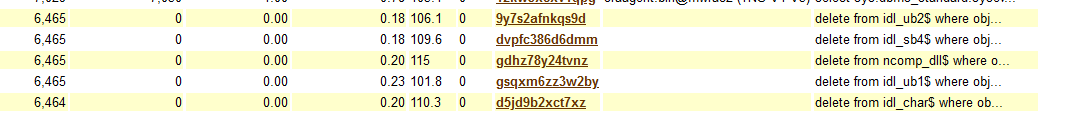
从这些数据字典DML来看,应该是在做DDL,结合等待ENQ-CR和ENQ-RO,应该是在做truncate或者drop相关操作,这肯定是不正常的
评论 有用 0 评论 有用 01、由于数据库集群时间的问题导致采集中显示的时间与真实时间相差12个小时,这个时间是今天下午1点至5点
2、如何定位到最影响的几个点上?
3、基于这个AWR 的IO是否是因为
version_count过高和10949事件没有关闭相关
评论 有用 0如果I/o因为串行表扫描的话,会有大量的direct path read,以及一些全表扫的SQL,你的awr里direct path read有一些,但是并不太高。
评论 有用 0老师 在ADDM中给的建议是加大SGA和PGA的数量,我的问题是在那里找addm的日志。
但还有个问题是如何找p1 和p2, 通过那个视图
例如这个提示:
Investigate the cause for high “enq: CR - block range reuse ckpt” waits
~~ with P1 (“name|mode”) value “1129447430” and P2 (“2”) value “131217”.~~
Finding 2: Unusual “Other” Wait Event
Impact is 1.22 active sessions, 25.97% of total activity.
Wait event “enq: CR - block range reuse ckpt” in wait class “Other” was
consuming significant database time.
Recommendation 1: Application Analysis
Estimated benefit is 1.22 active sessions, 25.97% of total activity.
Action
Investigate the cause for high “enq: CR - block range reuse ckpt” waits.
Refer to Oracle’s “Database Reference” for the description of this wait
event.
Recommendation 2: Application Analysis
Estimated benefit is 1.22 active sessions, 25.97% of total activity.
Action
Investigate the cause for high “enq: CR - block range reuse ckpt” waits
in Module “JDBC Thin Client”.
Recommendation 3: Application Analysis
Estimated benefit is 1.22 active sessions, 25.97% of total activity.
Action
Investigate the cause for high “enq: CR - block range reuse ckpt” waits
in Service “easdb”.
Recommendation 4: Application Analysis
Estimated benefit is .3 active sessions, 6.46% of total activity.
Action
Investigate the cause for high “enq: CR - block range reuse ckpt” waits
~~ with P1 (“name|mode”) value “1129447430” and P2 (“2”) value “131217”.~~
Symptoms That Led to the Finding:
  Wait class "Other" was consuming significant database time.
  Impact is 1.24 active sessions, 26.32% of total activity.复制
评论 有用 0不算老师哈,互相交流。
1.addm有以下几个办法可以获得
(1)运行Oracle自带的脚本:
$ORACLE_HOME/rdbms/admin/addmrpt.sql复制
(2)根据Oracle Database Performance Tuning Guide中ADDM章节使用dbms_addm包运行。
以19c为例,ADDM介绍如下:
https://docs.oracle.com/en/database/oracle/oracle-database/19/tgdba/automatic-performance-diagnostics.html#GUID-843A596D-2D8B-422D-9C8D-73C0EF52739D复制
- 一些等待事件的p1 p2简单解释可以从v$event_name查询
select name,parameter1 p1,parameter2 p2,parameter3 p3 from v$event_name where name like '%&event_name%'; 例如: SYS@honor1 > select name,parameter1 p1,parameter2 p2,parameter3 p3 from v$event_name where name like '%&event_name%'; Enter value for event_name: db file sequential read old 1: select name,parameter1 p1,parameter2 p2,parameter3 p3 from v$event_name where name like '%&event_name%' new 1: select name,parameter1 p1,parameter2 p2,parameter3 p3 from v$event_name where name like '%db file sequential read%' NAME P1 P2 P3 ---------------------------------------- --------------- --------------- --------------- db file sequential read file# block# blocks复制
评论 有用 0 墨值悬赏
墨值悬赏