

32. 金字塔图绘制
清除当前环境中的变量
rm(list=ls())复制
设置工作目录
setwd("C:/Users/Dell/Desktop/R_Plots/32pyramid/")复制
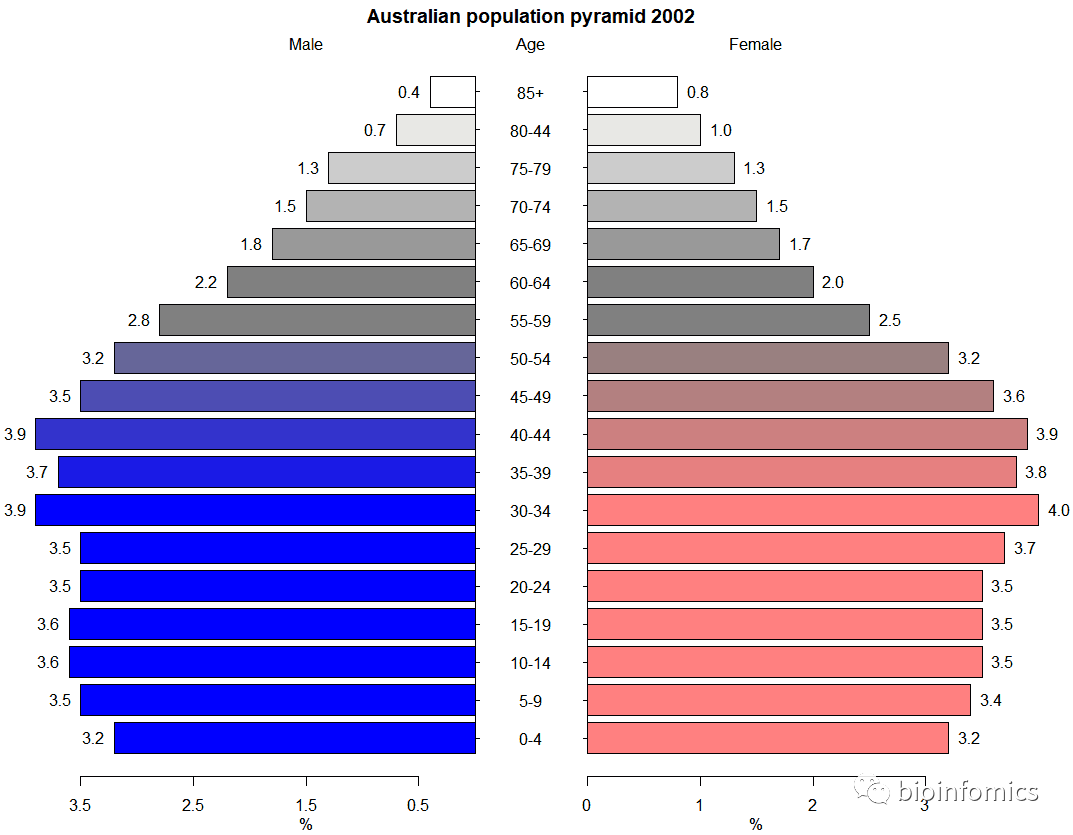
使用plotrix包绘制人口金字塔图
# 安装并加载所需的R包
#install.packages("plotrix")
library(plotrix)
# 构建示例数据
xy.pop<-c(3.2,3.5,3.6,3.6,3.5,3.5,3.9,3.7,3.9,3.5,
3.2,2.8,2.2,1.8,1.5,1.3,0.7,0.4)
xx.pop<-c(3.2,3.4,3.5,3.5,3.5,3.7,4,3.8,3.9,3.6,3.2,
2.5,2,1.7,1.5,1.3,1,0.8)
agelabels<-c("0-4","5-9","10-14","15-19","20-24","25-29","30-34",
"35-39","40-44","45-49","50-54","55-59","60-64",
"65-69","70-74","75-79","80-44","85+")
mcol<-color.gradient(c(0,0,0.5,1),c(0,0,0.5,1),c(1,1,0.5,1),18)
fcol<-color.gradient(c(1,1,0.5,1),c(0.5,0.5,0.5,1),c(0.5,0.5,0.5,1),18)
head(xy.pop)
## [1] 3.2 3.5 3.6 3.6 3.5 3.5
head(xx.pop)
## [1] 3.2 3.4 3.5 3.5 3.5 3.7
head(agelabels)
## [1] "0-4" "5-9" "10-14" "15-19" "20-24" "25-29"
head(mcol)
## [1] "#0000FFFF" "#0000FFFF" "#0000FFFF" "#0000FFFF" "#0000FFFF" "#0000FFFF"
head(fcol)
## [1] "#FF8080FF" "#FF8080FF" "#FF8080FF" "#FF8080FF" "#FF8080FF" "#FF8080FF"
# 使用pyramid.plot函数绘制人口金字塔图
par(mar=pyramid.plot(xy.pop,xx.pop,labels=agelabels,
main="Australian population pyramid 2002",
lxcol=mcol,rxcol=fcol,
gap=0.5,show.values=TRUE))复制
# three column matrices
avtemp<-c(seq(11,2,by=-1),rep(2:6,each=2),seq(11,2,by=-1))
malecook<-matrix(avtemp+sample(-2:2,30,TRUE),ncol=3)
femalecook<-matrix(avtemp+sample(-2:2,30,TRUE),ncol=3)
# group by age
agegrps<-c("0-10","11-20","21-30","31-40","41-50","51-60",
"61-70","71-80","81-90","91+")
head(malecook)
## [,1] [,2] [,3]
## [1,] 13 0 11
## [2,] 11 0 10
## [3,] 9 1 9
## [4,] 10 3 10
## [5,] 5 4 7
## [6,] 8 4 6
head(femalecook)
## [,1] [,2] [,3]
## [1,] 12 0 13
## [2,] 9 2 10
## [3,] 11 1 10
## [4,] 7 4 10
## [5,] 6 4 6
## [6,] 7 6 7
head(agegrps)
## [1] "0-10" "11-20" "21-30" "31-40" "41-50" "51-60"
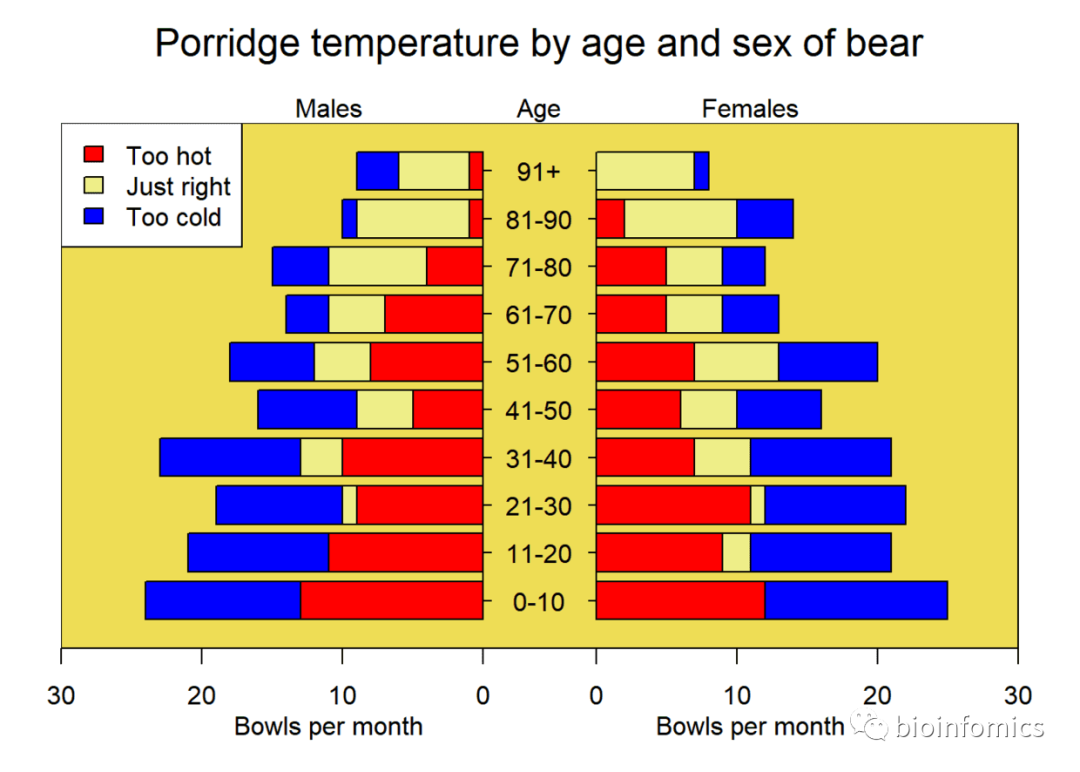
oldmar<-pyramid.plot(malecook,femalecook,labels=agegrps,
unit="Bowls per month",
lxcol=c("#ff0000","#eeee88","#0000ff"),
rxcol=c("#ff0000","#eeee88","#0000ff"),
laxlab=c(0,10,20,30),
raxlab=c(0,10,20,30),
top.labels=c("Males","Age","Females"),
gap=4,
do.first="plot_bg(\"#eedd55\")")
# give it a title
mtext("Porridge temperature by age and sex of bear",3,2,cex=1.5)
# stick in a legend
legend(par("usr")[1],11,legend = c("Too hot","Just right","Too cold"),
fill=c("#ff0000","#eeee88","#0000ff"))
# don't forget to restore the margins and background
par(mar=oldmar,bg="transparent")复制
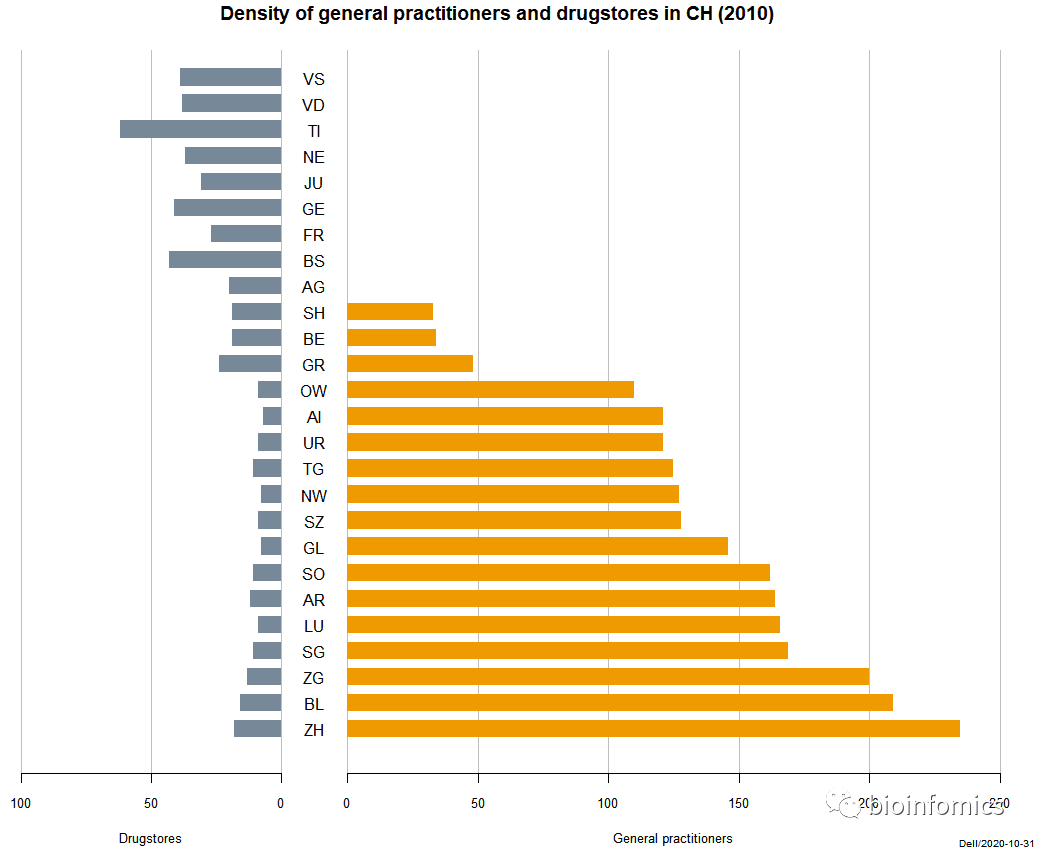
使用DescTools包绘制人金字塔图
# 安装并加载所需的R包
#install.packages("DescTools")
library(DescTools)
# 构建示例数据
d.sda <- data.frame(
kt_x = c("ZH","BL","ZG","SG","LU","AR","SO","GL","SZ",
"NW","TG","UR","AI","OW","GR","BE","SH","AG",
"BS","FR","GE","JU","NE","TI","VD","VS"),
apo_n = c(18,16,13,11,9,12,11,8,9,8,11,9,7,9,24,19,
19,20,43,27,41,31,37,62,38,39),
sda_n = c(235,209,200,169,166,164,162,146,128,127,
125,121,121,110,48,34,33,0,0,0,0,0,0,0,0,0)
)
head(d.sda)
## kt_x apo_n sda_n
## 1 ZH 18 235
## 2 BL 16 209
## 3 ZG 13 200
## 4 SG 11 169
## 5 LU 9 166
## 6 AR 12 164
# 使用PlotPyramid函数绘制人口金字塔图
PlotPyramid(lx=d.sda[,"apo_n"],
rx=d.sda[,"sda_n"],
ylab=d.sda$kt_x,
col=c("lightslategray", "orange2"),
border = NA, ylab.x=0,
xlim=c(-110,250),
gapwidth = NULL,
cex.lab = 0.8, cex.axis=0.8,
xaxt = TRUE,
lxlab="Drugstores",
rxlab="General practitioners",
main="Density of general practitioners and drugstores in CH (2010)",
space=0.5, args.grid=list(lty=1))复制
op <- par(mfrow=c(1,3))
m.pop<-c(3.2,3.5,3.6,3.6,3.5,3.5,3.9,3.7,3.9,3.5,
3.2,2.8,2.2,1.8,1.5,1.3,0.7,0.4)
f.pop<-c(3.2,3.4,3.5,3.5,3.5,3.7,4,3.8,3.9,3.6,3.2,
2.5,2,1.7,1.5,1.3,1,0.8)
age <- c("0-4","5-9","10-14","15-19","20-24","25-29",
"30-34","35-39","40-44","45-49","50-54",
"55-59","60-64","65-69","70-74","75-79","80-44","85+")
# 查看数据
head(m.pop)
## [1] 3.2 3.5 3.6 3.6 3.5 3.5
head(f.pop)
## [1] 3.2 3.4 3.5 3.5 3.5 3.7
head(age)
## [1] "0-4" "5-9" "10-14" "15-19" "20-24" "25-29"
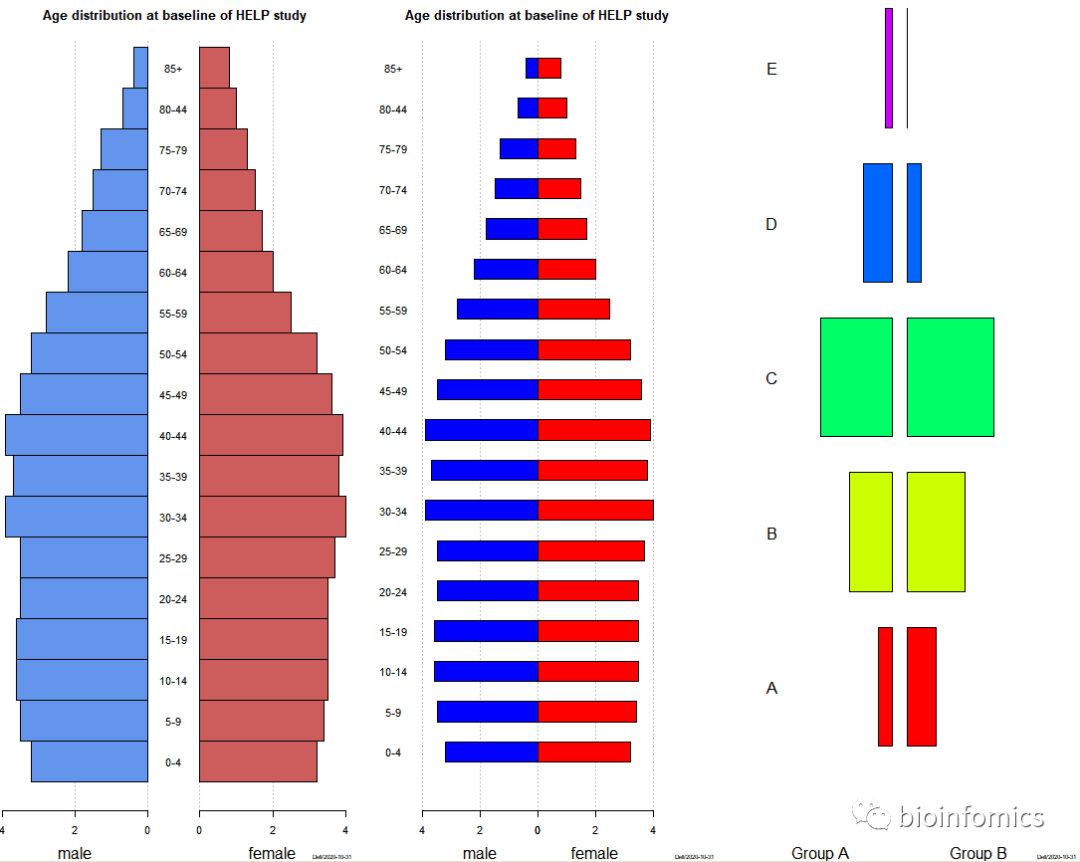
# 左侧图
PlotPyramid(m.pop, f.pop,
ylab = age, space = 0,
col = c("cornflowerblue", "indianred"),
main="Age distribution at baseline of HELP study",
lxlab="male", rxlab="female" )
# 中间图
PlotPyramid(m.pop, f.pop,
ylab = age, space = 1,
col = c("blue", "red"),
xlim=c(-5,5),
main="Age distribution at baseline of HELP study",
lxlab="male", rxlab="female",
gapwidth=0, ylab.x=-5 )
# 右侧图
PlotPyramid(c(1,3,5,2,0.5), c(2,4,6,1,0),
ylab = LETTERS[1:5], space = 0.3,
col = rep(rainbow(5), each=2),
xlim=c(-10,10), args.grid=NA,
cex.names=1.5, adj=1,
lxlab="Group A", rxlab="Group B",
gapwidth=1, ylab.x=-8, xaxt="n")
par(op)复制
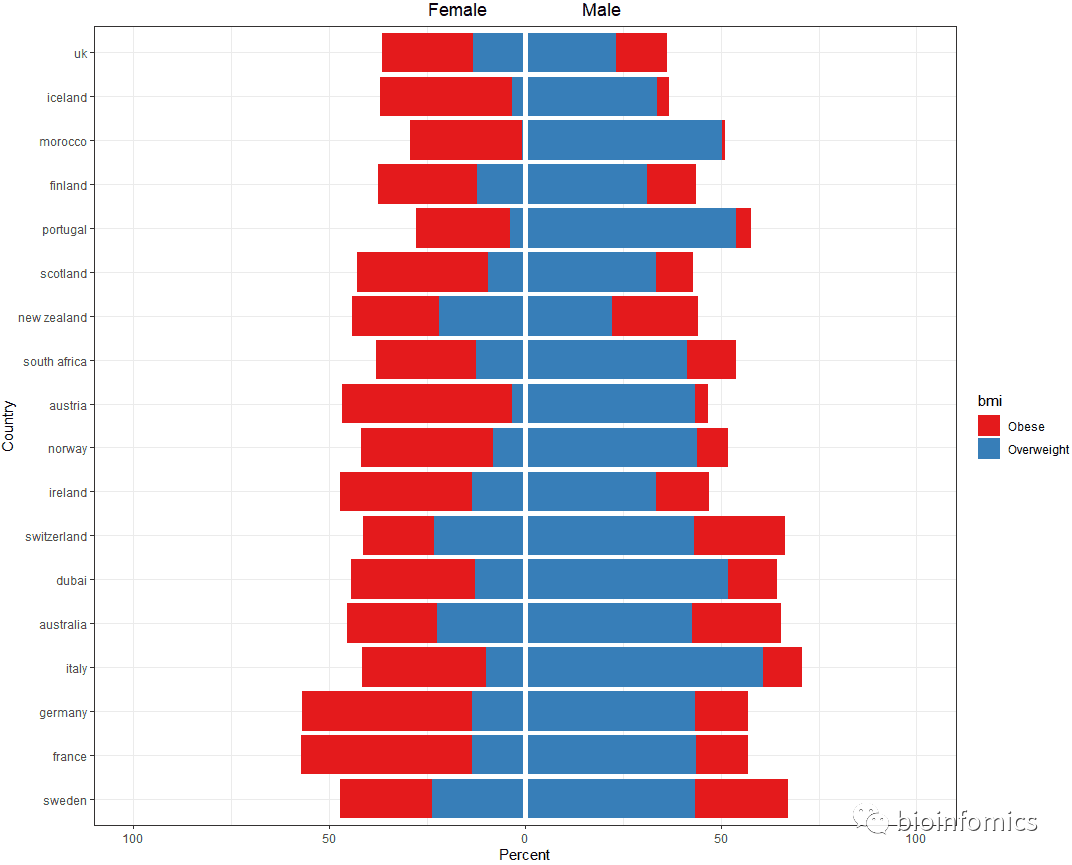
使用ggplot2包绘制金字塔图
library(ggplot2)
library(plyr)
# 构建示例数据
mov <-c(23.2,33.5,43.6,33.6,43.5,43.5,43.9,33.7,53.9,43.5,
43.2,42.8,22.2,51.8,41.5,31.3,60.7,50.4)
mob<-c(13.2,9.4,13.5,13.5,13.5,23.7,8,3.18,3.9,3.16,23.2,
22.5,22,12.7,12.5,12.3,10,0.8)
fov<-c(13.2,9.4,13.5,13.5,13.5,23.7,8,3.18,3.9,3.16,23.2,
22.5,22,12.7,12.5,12.3,10,0.8)
fob<-c(23.2,33.5,43.6,33.6,43.5,23.5,33.9,33.7,23.9,43.5,
18.2,22.8,22.2,31.8,25.5,25.3,31.7,28.4)
labs<-c("uk","scotland","france","ireland","germany","sweden","norway",
"iceland","portugal","austria","switzerland","australia",
"new zealand","dubai","south africa","finland","italy","morocco")
df = data.frame(labs=rep(labs,4), values=c(mov, mob, fov, fob),
sex=rep(c("Male", "Female"), each=2*length(fov)),
bmi = rep(rep(c("Overweight", "Obese"), each=length(fov)),2))
head(df)
## labs values sex bmi
## 1 uk 23.2 Male Overweight
## 2 scotland 33.5 Male Overweight
## 3 france 43.6 Male Overweight
## 4 ireland 33.6 Male Overweight
## 5 germany 43.5 Male Overweight
## 6 sweden 43.5 Male Overweight
# Order countries by overall percent overweight/obese
labs.order = ddply(df, .(labs), summarise, sum=sum(values))
labs.order = labs.order$labs[order(labs.order$sum,decreasing = T)]
# 设置因子进行排序
df$labs = factor(df$labs, levels=labs.order)
# 绘制金字塔图
ggplot(df, aes(x=labs)) +
geom_bar(data=subset(df,sex=="Male"), aes(y=values, fill=bmi), stat="identity") +
geom_bar(data=subset(df,sex=="Female"), aes(y=-values, fill=bmi), stat="identity") +
geom_hline(yintercept=0, colour="white", lwd=2) +
theme_bw()+
coord_flip(ylim=c(-100,100)) +
scale_fill_brewer(palette='Set1') +
scale_y_continuous(breaks=seq(-100,100,50), labels=c(100,50,0,50,100)) +
labs(y="Percent", x="Country") +
ggtitle("Female Male") +
theme(plot.title = element_text(hjust = 0.5))复制
sessionInfo()
## R version 3.6.0 (2019-04-26)
## Platform: x86_64-w64-mingw32/x64 (64-bit)
## Running under: Windows 10 x64 (build 18363)
##
## Matrix products: default
##
## locale:
## [1] LC_COLLATE=Chinese (Simplified)_China.936
## [2] LC_CTYPE=Chinese (Simplified)_China.936
## [3] LC_MONETARY=Chinese (Simplified)_China.936
## [4] LC_NUMERIC=C
## [5] LC_TIME=Chinese (Simplified)_China.936
##
## attached base packages:
## [1] stats graphics grDevices utils datasets methods base
##
## other attached packages:
## [1] plyr_1.8.4 ggplot2_3.2.0 DescTools_0.99.38 plotrix_3.7-6
##
## loaded via a namespace (and not attached):
## [1] Rcpp_1.0.5 RColorBrewer_1.1-2 compiler_3.6.0
## [4] pillar_1.4.2 class_7.3-15 tools_3.6.0
## [7] boot_1.3-23 digest_0.6.20 lifecycle_0.2.0
## [10] evaluate_0.14 tibble_2.1.3 rootSolve_1.8.2.1
## [13] gtable_0.3.0 lattice_0.20-38 pkgconfig_2.0.2
## [16] rlang_0.4.7 Matrix_1.2-17 rstudioapi_0.10
## [19] yaml_2.2.0 mvtnorm_1.0-11 expm_0.999-5
## [22] xfun_0.8 e1071_1.7-4 withr_2.1.2
## [25] dplyr_1.0.2 stringr_1.4.0 knitr_1.23
## [28] generics_0.0.2 vctrs_0.3.2 tidyselect_1.1.0
## [31] gld_2.6.2 grid_3.6.0 glue_1.4.2
## [34] R6_2.4.0 lmom_2.8 rmarkdown_1.13
## [37] purrr_0.3.2 magrittr_1.5 scales_1.0.0
## [40] htmltools_0.3.6 MASS_7.3-51.4 Exact_2.1
## [43] colorspace_1.4-1 stringi_1.4.3 lazyeval_0.2.2
## [46] munsell_0.5.0 crayon_1.3.4复制

END


文章转载自bioinfomics,如果涉嫌侵权,请发送邮件至:contact@modb.pro进行举报,并提供相关证据,一经查实,墨天轮将立刻删除相关内容。
评论
相关阅读
【专家观点】罗敏:从理论到真实SQL,感受DeepSeek如何做性能优化
墨天轮编辑部
1257次阅读
2025-03-06 16:45:38
【专家有话说第五期】在不同年龄段,DBA应该怎样规划自己的职业发展?
墨天轮编辑部
1250次阅读
2025-03-13 11:40:53
2025年2月国产数据库大事记
墨天轮编辑部
976次阅读
2025-03-05 12:27:34
2025年2月国产数据库中标情况一览:GoldenDB 3500+万!达梦近千万!
通讯员
862次阅读
2025-03-06 11:40:20
2月“墨力原创作者计划”获奖名单公布
墨天轮编辑部
447次阅读
2025-03-13 14:38:19
AI的优化能力,取决于你问问题的能力!
潇湘秦
416次阅读
2025-03-11 11:18:22
优炫数据库成功应用于国家电投集团青海海南州新能源电厂!
优炫软件
337次阅读
2025-03-21 10:34:08
达梦数据与法本信息签署战略合作协议
达梦数据
286次阅读
2025-03-06 09:26:57
国产化+性能王炸!这套国产方案让 3.5T 数据 5 小时“无感搬家”
YMatrix
271次阅读
2025-03-13 09:51:26
磐维数据库对外门户全新升级!
磐维数据库
237次阅读
2025-03-04 15:32:59


