


delve[1](以下简称dlv)是一个go语言debug工具。
如果读者有使用Goland进行debug的经验,应该很熟悉如下场景——
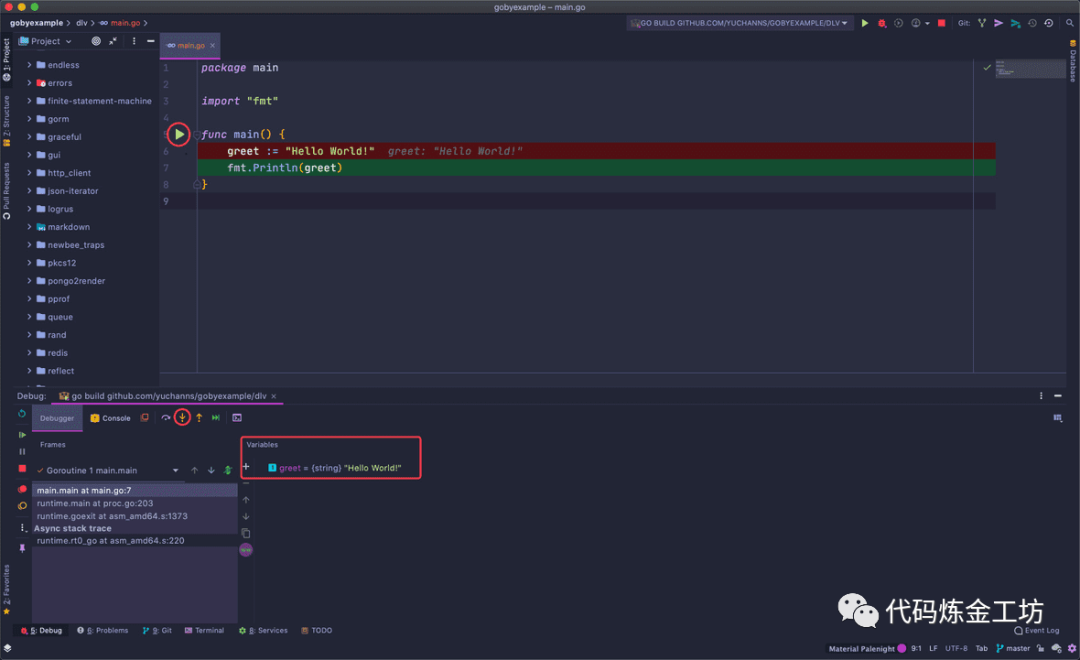
当我们进行debug的时候,只需要在代码对应的地方打上断点,然后右键
main
或者Test*
开头函数旁边的绿色三角箭头标记,选择debug,IDE就会自动执行到断点处并暂停程序的运行。接着我们在IDE下方弹出的Debug窗口里,点击黄色的箭头(Step Info
)就可以进行单步调试;同时我们还可以在Vriables框里看到该函数中被分配的变量类型及其内容等信息;在frame窗口里可以切换不同的goroutine并查看相应的栈帧,以及选择某一帧查看当时的信息。
这是JetBrains编辑器的福利之一(实际上也是使用dlv实现的),而一旦我们因为许可证问题(比如开源许可证不可用于商业开发)不能使用Goland,又该怎么进行debug呢?答案当然是开头提到的dlv。
快速开始
dlv的获取方式很简单,和平时拉取go第三方库的方式一样,执行go get -u github.com/go-delve/delve/cmd/dlv
即可。
❯ tree.├── README.md└── dlv└── main.go复制
打开你的终端,进入项目所在的根目录——本文以使用了go module管理的yuchanns/gobyexample[2]为例,它的module名为github.com/yuchanns/gobyexample
,项目结构如上——本例子试图对根目录下的dlv文件夹中的main.go文件进行debug;然后执行dlv debug github.com/yuchanns/gobyexample/dlv
开启了debug会话框:
dlv debug github.com/yuchanns/gobyexample/dlvType 'help' for list of commands.(dlv)复制
键入funs main
,得到包含main字眼的函数的信息,其中,属于用户编写的入口main函数为main.main
;接着输入b main.main
对该函数进行断点标记,然后键入c
直接运行到该断点处,可以看到会话输出了函数的内容:
(dlv) funcs mainmain.mainruntime.mainruntime.main.func1runtime.main.func2(dlv) b main.mainBreakpoint 1 set at 0x10c2393 for main.main() ./dlv/main.go:5(dlv) c> main.main() ./dlv/main.go:5 (hits goroutine(1):1 total:1) (PC: 0x10c2393)1: package main2:3: import "fmt"4:=> 5: func main() {6: greet := "Hello World!"7: fmt.Println(greet)8: }(dlv)复制
键入s
进行单步调试,连续两次,再键入locals
查看分配的局部变量信息:
(dlv) s> main.main() ./dlv/main.go:7 (PC: 0x10c23b6)2:3: import "fmt"4:5: func main() {6: greet := "Hello World!"=> 7: fmt.Println(greet)8: }(dlv) localsgreet = "Hello World!"(dlv)复制
体验和使用Goland自带的debug功能类似!当然,现在读者对上述的操作指令一无所知,不免感到迷惑。接下来笔者将结合help命令对常用的指令进行解释说明。
命令详解
我们以下面这段代码为例,内容为20个goroutine分别进行斐波那契数列的计算:
package mainimport ("fmt""sync")func FibIter(a, b, n int) int {if n == 0 {return b}return FibIter(a+b, a, n-1)}func Fib(n int) int {return FibIter(1, 0, n)}func main() {wg := sync.WaitGroup{}for i := 0; i < 20; i++ {wg.Add(1)go func(i int) {r := Fib((i + 1) * 100)fmt.Println(r)wg.Done()}(i)}wg.Wait()}复制
在开启的debug会话中,键入help
可以查看拥有哪些命令,以及命令的解释。在调试过程中可以经常使用辅助查询命令名称。
(dlv) helpThe following commands are available:Running the program:call ------------------------ Resumes process, injecting a function call (EXPERIMENTAL!!!)continue (alias: c) --------- Run until breakpoint or program termination.next (alias: n) ------------- Step over to next source line.rebuild --------------------- Rebuild the target executable and restarts it. It does not work if the executable was not built by delve.restart (alias: r) ---------- Restart process.step (alias: s) ------------- Single step through program.step-instruction (alias: si) Single step a single cpu instruction.stepout (alias: so) --------- Step out of the current function.Manipulating breakpoints:break (alias: b) ------- Sets a breakpoint.breakpoints (alias: bp) Print out info for active breakpoints.clear ------------------ Deletes breakpoint.clearall --------------- Deletes multiple breakpoints.condition (alias: cond) Set breakpoint condition.on --------------------- Executes a command when a breakpoint is hit.trace (alias: t) ------- Set tracepoint.Viewing program variables and memory:args ----------------- Print function arguments.display -------------- Print value of an expression every time the program stops.examinemem (alias: x) Examine memory:locals --------------- Print local variables.print (alias: p) ----- Evaluate an expression.regs ----------------- Print contents of CPU registers.set ------------------ Changes the value of a variable.vars ----------------- Print package variables.whatis --------------- Prints type of an expression.Listing and switching between threads and goroutines:goroutine (alias: gr) -- Shows or changes current goroutinegoroutines (alias: grs) List program goroutines.thread (alias: tr) ----- Switch to the specified thread.threads ---------------- Print out info for every traced thread.Viewing the call stack and selecting frames:deferred --------- Executes command in the context of a deferred call.down ------------- Move the current frame down.frame ------------ Set the current frame, or execute command on a different frame.stack (alias: bt) Print stack trace.up --------------- Move the current frame up.Other commands:config --------------------- Changes configuration parameters.disassemble (alias: disass) Disassembler.edit (alias: ed) ----------- Open where you are in $DELVE_EDITOR or $EDITORexit (alias: quit | q) ----- Exit the debugger.funcs ---------------------- Print list of functions.help (alias: h) ------------ Prints the help message.libraries ------------------ List loaded dynamic librarieslist (alias: ls | l) ------- Show source code.source --------------------- Executes a file containing a list of delve commandssources -------------------- Print list of source files.types ---------------------- Print list of typesType help followed by a command for full documentation.复制
键入help 命令
则可以查看更详细的单个命令使用文档。
笔者暂且先解释几个常用的命令:
exit
退出debug会话,也可以用quit
或者q
来代替。
funcs [<regex>]
打印名称符合正则匹配结果的函数;如果为空,则显示全部函数。
比如说我们要寻找上述的main
函数,输入funcs main
可以找到所有包含main
字符串的函数名。
[goroutine <n>] [frame <m>] list [<linespec>]
查看指定位置源码,可以用ls
代替。
命令前面可以选择查看第几个goroutine或者第几frame的源码,这个暂且不提。
命令后面可以是函数名称,例如FibIter
,也可以是文件名:行数
,例如gobyexample/dlv/main.go:8
,效果一样:
(dlv) l gobyexample/dlv/main.go:8Showing /Users/yuchanns/Coding/golang/gobyexample/dlv/main.go:8 (PC: 0x10c281f)3: import (4: "fmt"5: "sync"6: )7:8: func FibIter(a, b, n int) int {9: if n == 0 {10: return b11: }12:13: return FibIter(a+b, a, n-1)复制
break [name] <linespec>
进行断点,可以用b
代替。给定断点所在的文件名:行数
(一样可以用函数名代替,但是指定行数更灵活)。
例如笔者要把断点打在main.main
函数的for
关键字处。我们可以先用ls main.main
来查看源码,然后得知文件名以及for
关键字行数为gobyexample/dlv/main.go:22
。
于是使用b gobyexample/dlv/main.go:22
的方式打上一个断点。
(dlv) ls main.mainShowing /Users/yuchanns/Coding/golang/gobyexample/dlv/main.go:20 (PC: 0x10c2933)15:16: func Fib(n int) int {17: return FibIter(1, 0, n)18: }19:20: func main() {21: wg := sync.WaitGroup{}22: for i := 0; i < 20; i++ {23: wg.Add(1)24: go func(i int) {25: r := Fib((i + 1) * 100)(dlv) b gobyexample/dlv/main.go:22Breakpoint 1 set at 0x10c296a for main.main() ./dlv/main.go:22复制
continue
运行代码直到断点位置,或者程序终结。可以用c
代替。键入使代码快速运行到上面打断点的位置。
step
单步调试,可以用s
代替,作用就是一步一步执行代码。
比如现在我们停在22行代码,键入s
,前进到23行,22行代码就被运行了;如果再按两下s
,会发现我们不在第24行,而是跳转到了wg.Add
这个函数的内部。
(dlv) c> main.main() ./dlv/main.go:22 (hits goroutine(1):1 total:1) (PC: 0x10c296a)17: return FibIter(1, 0, n)18: }19:20: func main() {21: wg := sync.WaitGroup{}=> 22: for i := 0; i < 20; i++ {23: wg.Add(1)24: go func(i int) {25: r := Fib((i + 1) * 100)26: fmt.Println(r)27: wg.Done()(dlv) s> main.main() ./dlv/main.go:23 (PC: 0x10c297f)18: }19:20: func main() {21: wg := sync.WaitGroup{}22: for i := 0; i < 20; i++ {=> 23: wg.Add(1)24: go func(i int) {25: r := Fib((i + 1) * 100)26: fmt.Println(r)27: wg.Done()28: }(i)(dlv) s> sync.(*WaitGroup).Add() /usr/local/go/src/sync/waitgroup.go:53 (PC: 0x107c853)48: // Typically this means the calls to Add should execute before the statement49: // creating the goroutine or other event to be waited for.50: // If a WaitGroup is reused to wait for several independent sets of events,51: // new Add calls must happen after all previous Wait calls have returned.52: // See the WaitGroup example.=> 53: func (wg *WaitGroup) Add(delta int) {54: statep, semap := wg.state()55: if race.Enabled {56: _ = *statep // trigger nil deref early57: if delta < 0 {58: // Synchronize decrements with Wait.复制
stepout
标准库的代码,并不是我们此次debug的重点,实际上我们并不想要查看它的细节。那么要如何退出呢?
答案是使用stepout
或者其缩写so
,这样调试器就会快速运行完该函数内部的代码,并跳回main.main
。
next [count]
再次键入两次s
,因为循环,又回到了23行的wg.Add
处。如果每次都需要进入到函数内部,然后再使用so
跳出,未免也太麻烦了?
这时候我们可以用next
或其缩写n
来跳过wg.Add
执行细节,直接运行到24行。如果在命令上加上数字则可以指定直接运行多少行代码。
goroutines
用于显示当前所有的goroutine情况,以及各自的编号。可在命令后面追加flag,用于决定每条记录的附带显示信息。
该命令可以grs
代替,键入命令,我们发现当前一共有7个goroutine在进行:
(dlv) grs* Goroutine 1 - User: ./dlv/main.go:22 main.main (0x10c29ce) (thread 145740)Goroutine 2 - User: /usr/local/go/src/runtime/proc.go:305 runtime.gopark (0x103623b)Goroutine 3 - User: /usr/local/go/src/runtime/proc.go:305 runtime.gopark (0x103623b)Goroutine 4 - User: /usr/local/go/src/runtime/proc.go:305 runtime.gopark (0x103623b)Goroutine 17 - User: /usr/local/go/src/runtime/proc.go:305 runtime.gopark (0x103623b)Goroutine 19 - User: ./dlv/main.go:13 main.FibIter (0x10c2879) (thread 146294)Goroutine 20 - User: ./dlv/main.go:24 main.main.func1 (0x10c2a10)[7 goroutines]复制
goroutine <id> <command>
刚才我们注意到,虽然键入s可以逐步运行代码,但是仅限于主函数所在的内容,却无法查看到goroutine内部函数的运行状态。
这是就轮到goroutine
派上用场了,该命令也可以用gr
代替,加上grs
命令显示的goroutine编号,可以将debug视角切换到goroutine内部。比如说我们使用gr 19
来查看19号goroutine。然后键入ls
查看当前运行的源码情况:
(dlv) gr 19Switched from 1 to 19 (thread 146294)(dlv) ls> main.FibIter() ./dlv/main.go:13 (PC: 0x10c2879)8: func FibIter(a, b, n int) int {9: if n == 0 {10: return b11: }12:=> 13: return FibIter(a+b, a, n-1)14: }15:16: func Fib(n int) int {17: return FibIter(1, 0, n)18: }复制
此时我们就可以在该goroutine内部进行单步调试,或者打上断点,快速执行等等操作。
注:部分读者可能会发现,输入
ls
之后,看到的却是runtime内部的函数或者plan9汇编代码,这是因为goroutine的执行时机不确定,所以看到的不一定是笔者上面这种理想结果。不过不必担心,遇到这种情况可以结合ls
命令以及b
命令,先查出FibIter源码的位置信息,然后打上断点,再使用c
命令直接运行到此处。
args和locals
这两个命令的用法类似,都是[goroutine <n>] [frame <m>] args|locals [-v] [<regex>]
,可以指定goroutine编号或者frame编号,然后加正则匹配名称。作用是用来查看变量的信息。
其中args
用来查看函数入口的形参信息,而locals
则用来查看函数内部分配的实参的信息。
在这个例子中,我们只有形参,键入args
可以看到FibIter函数内部的全部形参信息:
(dlv) argsa = 1b = 1n = 99~r3 = 0复制
breakpoint和clear和clearall
breakpoint
或简写bp
命令可以打印出目前正在使用中的全部断点信息,其中包括断点名称。
然后执行clear 断点名称
的方式来删除指定的断点;也可以用clearall [<linespec>]
的方式删除所有正则匹配的行数的断点。
(dlv) bpBreakpoint runtime-fatal-throw at 0x1033970 for runtime.fatalthrow() /usr/local/go/src/runtime/panic.go:1158 (0)Breakpoint unrecovered-panic at 0x10339e0 for runtime.fatalpanic() /usr/local/go/src/runtime/panic.go:1185 (0)print runtime.curg._panic.argBreakpoint 1 at 0x10c296a for main.main() ./dlv/main.go:22 (1)Breakpoint 2 at 0x10c281f for main.FibIter() ./dlv/main.go:8 (3)(dlv) clear 2Breakpoint 2 cleared at 0x10c281f for main.FibIter() ./dlv/main.go:8(dlv) bpBreakpoint runtime-fatal-throw at 0x1033970 for runtime.fatalthrow() /usr/local/go/src/runtime/panic.go:1158 (0)Breakpoint unrecovered-panic at 0x10339e0 for runtime.fatalpanic() /usr/local/go/src/runtime/panic.go:1185 (0)print runtime.curg._panic.argBreakpoint 1 at 0x10c296a for main.main() ./dlv/main.go:22 (1)复制
stack和frame
前面的命令中曾提到frame,可能有的读者对此有疑问,现在进行说明。
我们对源码进行调试时,偶尔会产生需要回顾之前运行过的代码片段的信息需求,就好比上面的斐波那契递归,在调试下已经递归了20次,然后需要查看第18次的信息,这时候就可以通过查阅frame来满足需求。
frame实际上是栈帧,即记录了每一个函数调用过程的信息帧。可以用stack
或者简称bt
来获取栈上的帧信息。
每一帧都记录了执行的函数对应的文件地址,可以据此判断哪一帧才是我们需要的。
然后使用frame 帧编号
的方式进入该帧,结合上面的命令查看该帧中的相应信息。
(dlv) bt0 0x00000000010c2854 in main.FibIterat ./dlv/main.go:131 0x00000000010c287e in main.FibIterat ./dlv/main.go:132 0x00000000010c287e in main.FibIterat ./dlv/main.go:133 0x00000000010c287e in main.FibIterat ./dlv/main.go:134 0x00000000010c287e in main.FibIterat ./dlv/main.go:135 0x00000000010c287e in main.FibIterat ./dlv/main.go:136 0x00000000010c287e in main.FibIterat ./dlv/main.go:137 0x00000000010c287e in main.FibIterat ./dlv/main.go:138 0x00000000010c287e in main.FibIterat ./dlv/main.go:139 0x00000000010c287e in main.FibIterat ./dlv/main.go:1310 0x00000000010c287e in main.FibIterat ./dlv/main.go:1311 0x00000000010c287e in main.FibIterat ./dlv/main.go:1312 0x00000000010c287e in main.FibIterat ./dlv/main.go:1313 0x00000000010c287e in main.FibIterat ./dlv/main.go:1314 0x00000000010c287e in main.FibIterat ./dlv/main.go:1315 0x00000000010c287e in main.FibIterat ./dlv/main.go:1316 0x00000000010c287e in main.FibIterat ./dlv/main.go:1317 0x00000000010c287e in main.FibIterat ./dlv/main.go:1318 0x00000000010c28f6 in main.Fibat ./dlv/main.go:1719 0x00000000010c2a4a in main.main.func1at ./dlv/main.go:2520 0x0000000001063a91 in runtime.goexitat /usr/local/go/src/runtime/asm_amd64.s:1373(dlv) frame 1> main.FibIter() ./dlv/main.go:13 (PC: 0x10c2854)Frame 1: ./dlv/main.go:13 (PC: 10c287e)8: func FibIter(a, b, n int) int {9: if n == 0 {10: return b11: }12:=> 13: return FibIter(a+b, a, n-1)14: }15:16: func Fib(n int) int {17: return FibIter(1, 0, n)18: }(dlv) argsa = 1597b = 987n = 84~r3 = 0(dlv)复制
restart和rebuild
restart
或简写r
命令可以重新起一个进程来进行debug,从头进行,而此次会话设置的断点等信息依旧会保存下来,不需要重新设置断点。
rebuild
则是重新编译二进制,用于如果代码有更新的情况。需要注意的是,如果原本不是由dlv所编译的二进制,此命令不会生效。
更多的命令
限于篇幅,笔者没有把所有的命令都详细写出,其实有了上面的基础,读者在学习其他命令的过程中应当没有什么麻烦。
值得注意的是,其中有一些命令可以相互组合使用:比如说print
、b
和on
,可以实现每次运行到断点部分时,自动打印出变量信息:
(dlv) b gobyexample/dlv/main.go:8Breakpoint 2 set at 0x10c281f for main.FibIter() ./dlv/main.go:8(dlv) on 2 print a(dlv) c> main.FibIter() ./dlv/main.go:8 (hits goroutine(34):1 total:2) (PC: 0x10c281f)a: 2584> main.FibIter() ./dlv/main.go:8 (hits goroutine(35):1 total:2) (PC: 0x10c281f)a: 13: import (4: "fmt"5: "sync"6: )7:=> 8: func FibIter(a, b, n int) int {9: if n == 0 {10: return b11: }12:13: return FibIter(a+b, a, n-1)复制
其他debug方式
前两节,笔者都是围绕dlv debug
命令进行描述。有时候我们因为环境配置等问题,无法直接编译并启动整个二进制文件进行debug。
通常,在测试局部功能时,都是通过编写测试用例进行,dlv自然也支持这种方法。
在此之前,我们也可以执行dlv help
看看除了debug
外都有哪些其他命令:
❯ dlv helpDelve is a source level debugger for Go programs.Delve enables you to interact with your program by controlling the execution of the process,evaluating variables, and providing information of thread / goroutine state, CPU register state and more.The goal of this tool is to provide a simple yet powerful interface for debugging Go programs.Pass flags to the program you are debugging using `--`, for example:`dlv exec ./hello -- server --config conf/config.toml`Usage:dlv [command]Available Commands:attach Attach to running process and begin debugging.connect Connect to a headless debug server.core Examine a core dump.dap [EXPERIMENTAL] Starts a TCP server communicating via Debug Adaptor Protocol (DAP).debug Compile and begin debugging main package in current directory, or the package specified.exec Execute a precompiled binary, and begin a debug session.help Help about any commandrun Deprecated command. Use 'debug' instead.test Compile test binary and begin debugging program.trace Compile and begin tracing program.version Prints version.Flags:--accept-multiclient Allows a headless server to accept multiple client connections.--api-version int Selects API version when headless. New clients should use v2. Can be reset via RPCServer.SetApiVersion. See Documentation/api/json-rpc/README.md. (default 1)--backend string Backend selection (see 'dlv help backend'). (default "default")--build-flags string Build flags, to be passed to the compiler.--check-go-version Checks that the version of Go in use is compatible with Delve. (default true)--headless Run debug server only, in headless mode.-h, --help help for dlv--init string Init file, executed by the terminal client.-l, --listen string Debugging server listen address. (default "127.0.0.1:0")--log Enable debugging server logging.--log-dest string Writes logs to the specified file or file descriptor (see 'dlv help log').--log-output string Comma separated list of components that should produce debug output (see 'dlv help log')--only-same-user Only connections from the same user that started this instance of Delve are allowed to connect. (default true)--wd string Working directory for running the program. (default ".")Additional help topics:dlv backend Help about the --backend flag.dlv log Help about logging flags.Use "dlv [command] --help" for more information about a command.复制
attach
可以使用dlv跟踪一个正在运行的程序。
core
则可以对一个golang的core dump
文件进行回溯。
注:什么是
core dump
文件?当一份代码编译后运行一段时间会发生崩溃,但是又很难定位错误时,较原始的办法是不停地在一些关键代码上报日志;而一个更方便的方法则是通过设置环境变量GOTRACEBACK=crash
,生成一份进程运行直到崩溃时详细信息的快照,然后对这个快照进行回溯。
对测试用例所在的目录执行dlv test github.com/yuchanns/gobyexample/dlv
,然后对测试函数进行断点,其余操作和前两节一致:
// gobyexample/dlv/pkg_test.gopackage mainimport ("testing")func TestFib(t *testing.T) {r := Fib(5)if r != 5 {t.Error("Fib(5) is not equal to 5")}}复制
❯ dlv test github.com/yuchanns/gobyexample/dlvType 'help' for list of commands.(dlv) b TestFibBreakpoint 1 set at 0x114ea03 for github.com/yuchanns/gobyexample/dlv.TestFib() ./dlv/pkg_test.go:7(dlv) c> github.com/yuchanns/gobyexample/dlv.TestFib() ./dlv/pkg_test.go:7 (hits goroutine(6):1 total:1) (PC: 0x114ea03)2:3: import (4: "testing"5: )6:=> 7: func TestFib(t *testing.T) {8: r := Fib(5)9: if r != 5 {10: t.Error("Fib(5) is not equal to 5")11: }12: }(dlv) argst = (*testing.T)(0xc00011c120)(dlv) s> github.com/yuchanns/gobyexample/dlv.TestFib() ./dlv/pkg_test.go:8 (PC: 0x114ea11)3: import (4: "testing"5: )6:7: func TestFib(t *testing.T) {=> 8: r := Fib(5)9: if r != 5 {10: t.Error("Fib(5) is not equal to 5")11: }12: }(dlv) s> github.com/yuchanns/gobyexample/dlv.Fib() ./dlv/main.go:16 (PC: 0x114e98f)11: }12:13: return FibIter(a+b, a, n-1)14: }15:=> 16: func Fib(n int) int {17: return FibIter(1, 0, n)18: }19:20: func main() {21: wg := sync.WaitGroup{}(dlv) cPASSProcess 9612 has exited with status 0(dlv)复制
引用链接
[1]
delve: https://github.com/go-delve/delve[2]
yuchanns/gobyexample: https://github.com/yuchanns/gobyexample
