


openGauss洗冤录 之 copy from

引子
之前一篇《测评报告:文件导入哪家强?》关于openGauss性能与预期不符的问题留下了个坑,今天回来填坑。
前文提到使用openGauss的copy from导入csv文件耗时是mysql的2倍,是PostgreSQL的6倍,这个结果与我预期结果有较大的差距。由于之前的测试都是基于各数据库产品的默认配,所以,未必能反应出其真实性能,尤其是openGauss,我个人认为其性能是被严重低估了。这篇文章将通过参数的调整/优化,看看是否可以还原openGauss的真实性能。由于能力有限,也欢迎大家留言反馈更好的优化方案。
测试场景
测试环境
这里使用的是信创环境的虚拟机和过程开源操作系统openEuler。
服务器
| 配置 | 参数 |
|---|---|
| CPU | Kunpeng-920 |
| Architecture | aarch64 |
| On-line CPU(s) list | 0-7 |
| CPU主频 | 2600MHz |
操作系统
NAME="openEuler"
VERSION="20.03 (LTS-SP2)"
ID="openEuler"
VERSION_ID="20.03"
PRETTY_NAME="openEuler 20.03 (LTS-SP2)"
ANSI_COLOR="0;31"
复制
系统性能
- 以下是unixbench跑分,供对比参考
------------------------------------------------------------------------
Benchmark Run: Wed Dec 07 2022 15:48:16 - 15:57:14
8 CPUs in system; running 1 parallel copy of tests

Dhrystone 2 using register variables       40999324.8 lps   (10.0 s, 2 samples)
Double-Precision Whetstone                     4314.8 MWIPS (9.3 s, 2 samples)
Execl Throughput                               3762.5 lps   (29.8 s, 1 samples)
File Copy 1024 bufsize 2000 maxblocks        685100.0 KBps  (30.0 s, 1 samples)
File Copy 256 bufsize 500 maxblocks          189282.0 KBps  (30.0 s, 1 samples)
File Copy 4096 bufsize 8000 maxblocks       1992147.0 KBps  (30.0 s, 1 samples)
Pipe Throughput                             1231178.1 lps   (10.0 s, 2 samples)
Pipe-based Context Switching                 105636.0 lps   (10.0 s, 2 samples)
Process Creation                               8963.6 lps   (30.0 s, 1 samples)
Shell Scripts (1 concurrent)                   7087.6 lpm   (60.0 s, 1 samples)
Shell Scripts (8 concurrent)                   3055.4 lpm   (60.0 s, 1 samples)
System Call Overhead                         907956.1 lps   (10.0 s, 2 samples)

System Benchmarks Index Values               BASELINE       RESULT    INDEX
Dhrystone 2 using register variables         116700.0   40999324.8   3513.2
Double-Precision Whetstone                       55.0       4314.8    784.5
Execl Throughput                                 43.0       3762.5    875.0
File Copy 1024 bufsize 2000 maxblocks          3960.0     685100.0   1730.1
File Copy 256 bufsize 500 maxblocks            1655.0     189282.0   1143.7
File Copy 4096 bufsize 8000 maxblocks          5800.0    1992147.0   3434.7
Pipe Throughput                               12440.0    1231178.1    989.7
Pipe-based Context Switching                   4000.0     105636.0    264.1
Process Creation                                126.0       8963.6    711.4
Shell Scripts (1 concurrent)                     42.4       7087.6   1671.6
Shell Scripts (8 concurrent)                      6.0       3055.4   5092.4
System Call Overhead                          15000.0     907956.1    605.3
                                                                   ========
System Benchmarks Index Score                                        1258.0

------------------------------------------------------------------------
Benchmark Run: Wed Dec 07 2022 15:57:14 - 16:06:18
8 CPUs in system; running 16 parallel copies of tests

Dhrystone 2 using register variables      326630138.1 lps   (10.0 s, 2 samples)
Double-Precision Whetstone                    35757.3 MWIPS (8.7 s, 2 samples)
Execl Throughput                              23047.5 lps   (29.7 s, 1 samples)
File Copy 1024 bufsize 2000 maxblocks        525702.0 KBps  (30.0 s, 1 samples)
File Copy 256 bufsize 500 maxblocks          139688.0 KBps  (30.0 s, 1 samples)
File Copy 4096 bufsize 8000 maxblocks       1834232.0 KBps  (30.0 s, 1 samples)
Pipe Throughput                             9754452.8 lps   (10.0 s, 2 samples)
Pipe-based Context Switching                1181849.8 lps   (10.0 s, 2 samples)
Process Creation                              42295.7 lps   (30.0 s, 1 samples)
Shell Scripts (1 concurrent)                  32399.6 lpm   (60.0 s, 1 samples)
Shell Scripts (8 concurrent)                   4529.9 lpm   (60.1 s, 1 samples)
System Call Overhead                        3386402.8 lps   (10.0 s, 2 samples)

System Benchmarks Index Values               BASELINE       RESULT    INDEX
Dhrystone 2 using register variables         116700.0  326630138.1  27988.9
Double-Precision Whetstone                       55.0      35757.3   6501.3
Execl Throughput                                 43.0      23047.5   5359.9
File Copy 1024 bufsize 2000 maxblocks          3960.0     525702.0   1327.5
File Copy 256 bufsize 500 maxblocks            1655.0     139688.0    844.0
File Copy 4096 bufsize 8000 maxblocks          5800.0    1834232.0   3162.5
Pipe Throughput                               12440.0    9754452.8   7841.2
Pipe-based Context Switching                   4000.0    1181849.8   2954.6
Process Creation                                126.0      42295.7   3356.8
Shell Scripts (1 concurrent)                     42.4      32399.6   7641.4
Shell Scripts (8 concurrent)                      6.0       4529.9   7549.8
System Call Overhead                          15000.0    3386402.8   2257.6
                                                                   ========
System Benchmarks Index Score                                        4252.8

复制
数据准备
使用benchmarksql-5.0中的历史表作为被测表,建表脚本如下:
create table bmsql_history (
  hist_id  integer,
  h_c_id   integer,
  h_c_d_id integer,
  h_c_w_id integer,
  h_d_id   integer,
  h_w_id   integer,
  h_date   timestamp,
  h_amount decimal(6,2),
  h_data   varchar(24)
);
复制
测试数据生成脚本
根据字段类型写了一个生成测试数据的脚本,代码如下:
# -*- coding=utf-8 -*-

import csv
import random
import time
import string

# 创建列表,保存header内容
header_list = ["hist_id", "h_c_id", "h_c_d_id", "h_c_w_id", "h_d_id", "h_w_id", "h_date", "h_amount", "h_data"]

g_count = 0

def random_list(n):
    data_list = []
    global g_count
    for i in range(n):
        g_count = g_count + 1
        l = [g_count,
        random.randint(0,1000),
        random.randint(0,1000),
        random.randint(0,1000),
        random.randint(0,1000),
        random.randint(0,1000),
        time.strftime("%Y-%m-%d %H:%M:%S", time.localtime()),
        #random.randint(0,1000),
        round(random.uniform(0, 9999.0), 2),
        ''.join(random.sample(string.ascii_letters + string.digits, 20))
        ]
        data_list.append(l)

    return data_list

# 以写方式打开文件。注意添加 newline="",否则会在两行数据之间都插入一行空白。
with open("bmsql_history.csv", mode="w", encoding="utf-8", newline="") as f:

    # 基于打开的文件,创建 csv.writer 实例
    writer = csv.writer(f)

    # 写入 header。
    # writerow() 一次只能写入一行。
    writer.writerow(header_list)

    # 写入数据。
    # writerows() 一次写入多行。
    for i in range(10000):
        writer.writerows(random_list(1000))

复制
测试数据
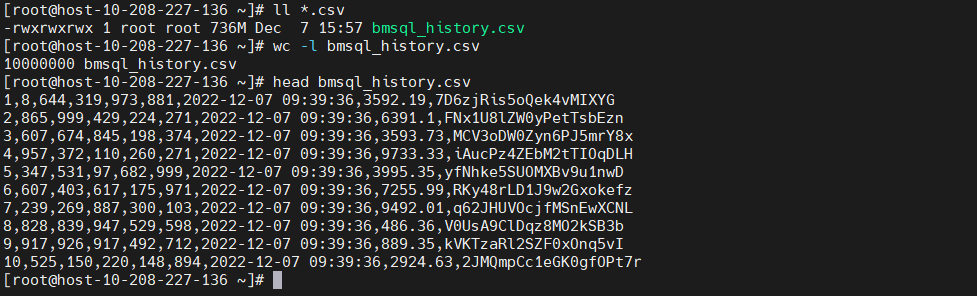
执行脚本后会生成10000000行测试数据,具体如下图:
初始性能
PostgreSQL
- 版本信息
- 测试结果
postgres=# copy bmsql_history from '/home/postgres/bmsql_history.csv' delimiter ','
postgres-# ;
COPY 10000000
Time: 19829.354 ms (00:19.829)
复制
openGauss
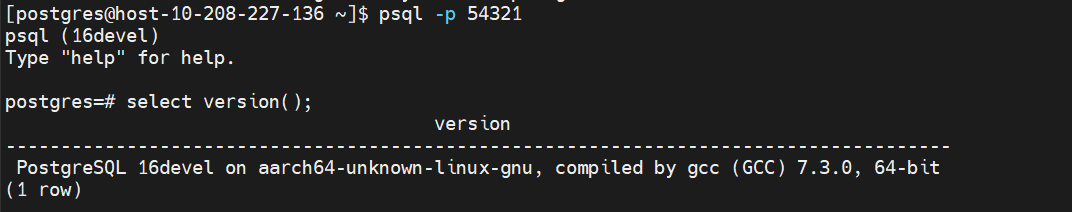
- 版本信息
openGauss=# select version();
                                                                        version
-------------------------------------------------------------------------------------------------------------------------------------------------------
 (openGauss 3.1.0 build 4e931f9a) compiled at 2022-09-29 14:19:54 commit 0 last mr   on aarch64-unknown-linux-gnu, compiled by g++ (GCC) 7.3.0, 64-bit
(1 row)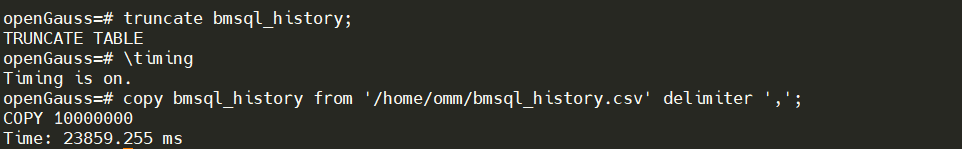
复制- 测试结果
openGauss=# \timing
Timing is on.
openGauss=# copy bmsql_history from '/home/omm/bmsql_history.csv' delimiter ',';
COPY 10000000
Time: 122703.615 ms
openGauss=# select version();
复制
测试结果对比
- 耗时
| openGauss 3.1.0 | PostgreSQL 16devel |
|---|---|
| 122703.615 ms | 19718.946 ms |
优化
分析
PostgreSQL
基版本数据
耗时:19718.946 ms
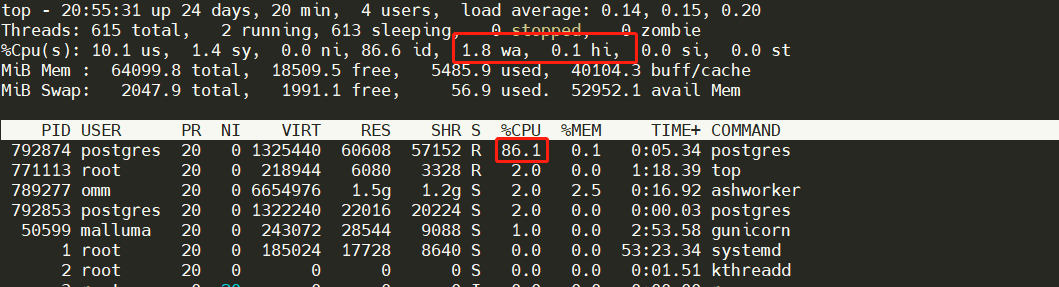
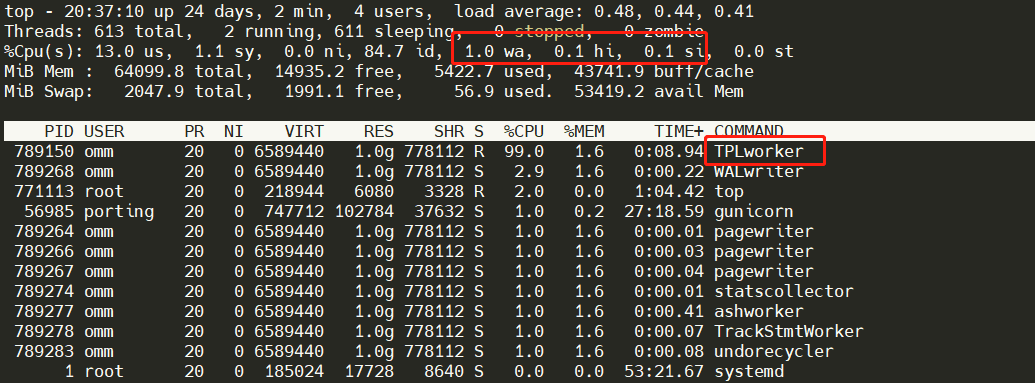
top
从资源使用上看,CPU使用并不高,说明可能是内存或I/O交互可能存在瓶颈,top显示基本可以确认这一点,wa在15(wa > 5说明已经存在I/O瓶颈)
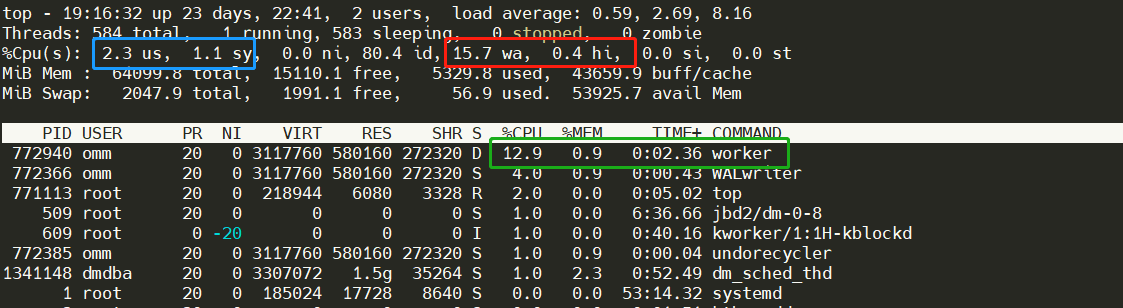
说明:1. worker的CPU使用率为12.9%,说明server端并未达到最大化性能。2.wa为15.7,说明I/O延时已经成为瓶颈,且存在一定的硬中断hi,3. sy:us 为1.1:2.3,也能说明内核的I/O操作频繁;
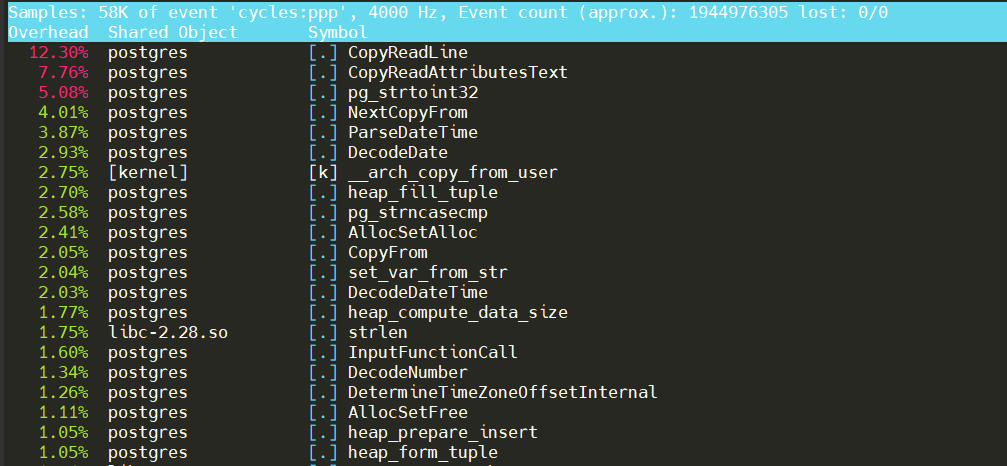
perf
perf检查热点,看上去比较正常。
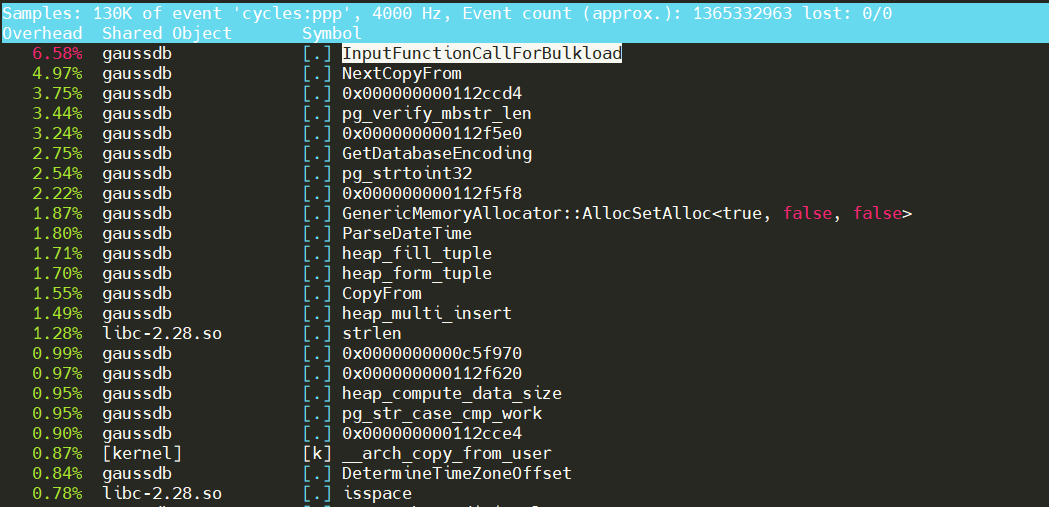
与PostgreSQL的perf(下图)相差不多。
优化一
优化项
调整shared_buffers
# shared_buffers = 64MB # openGauss默认为64MB
shared_buffers = 128MB
复制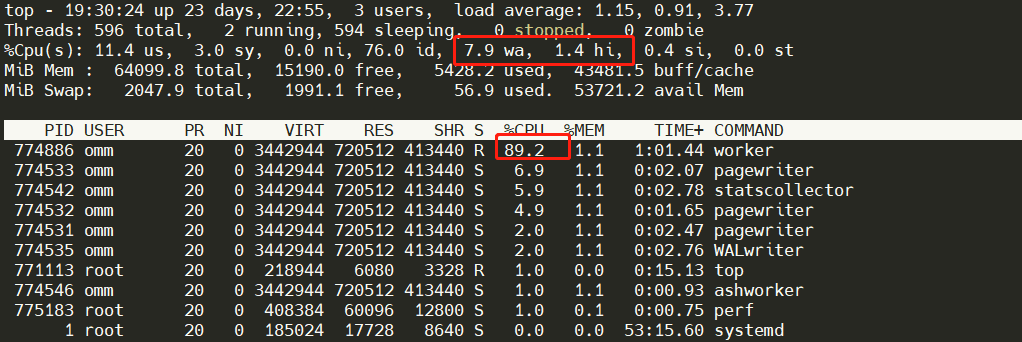
说明:shared_buffers = 128MB 于PostgreSQL的默认出世配置相同;先把openGauss和PostgreSQL的shared_buffers起跑线拉齐。I/O有下降,CPU使用率也有明显提升。
测试结果
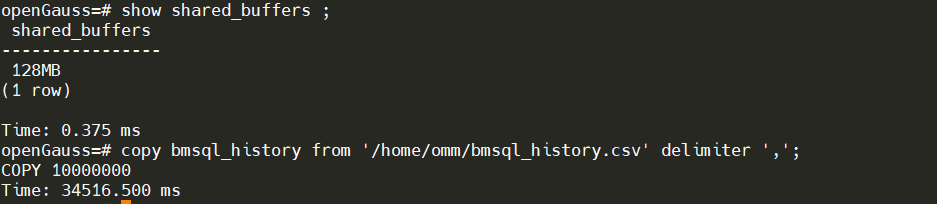
耗时:34516.500 ms
极限优化
上面对shared_buffers的优化的测试结果说明shared_buffers优化有效,所以可以按照这个思路继续进行优化,索性可以将shared_buffers调整为1GB。
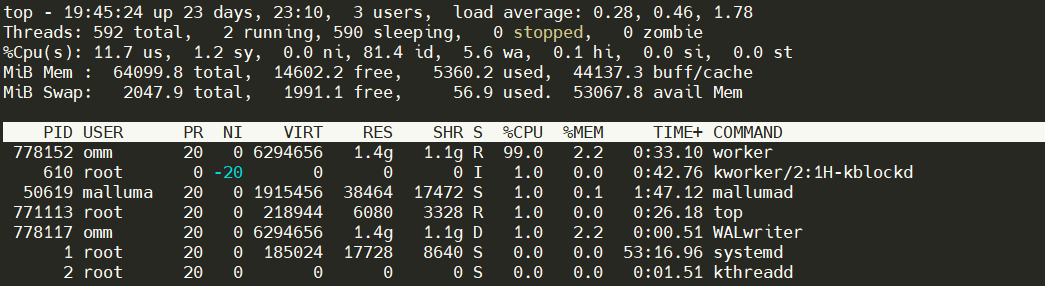
说明:shared_buffers足够大的情况下CPU基本上可以跑满了,IO延迟也基本稳定。结果如下:
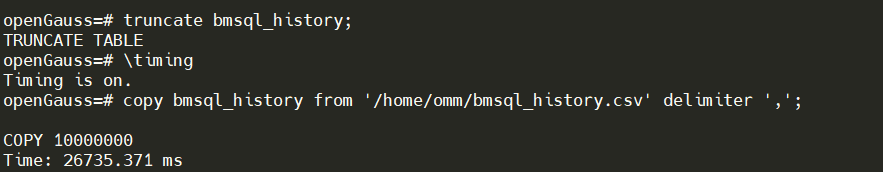
耗时:26735.371 ms
优化二
优化项
通过一些常用的优化参数试试效果。
audit_enabled = off bulk_write_ring_size = 2GB enable_beta_opfusion = on enable_opfusion = on hot_standby = off wal_log_hints = off work_mem = 64MB复制
测试结果
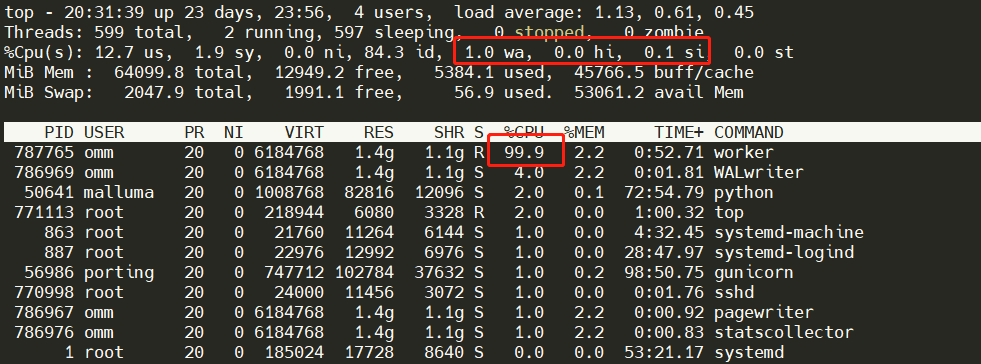
可以看到,IO等待有明显下降,CPU以达到极限。
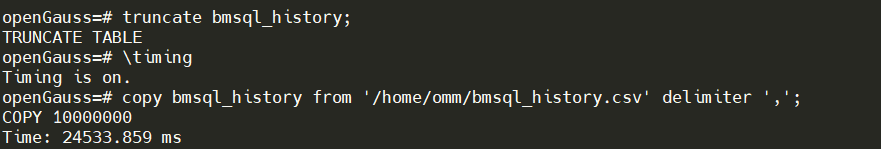
耗时:24533.859 ms
优化三
优化项
开启线程池进行尝试,因为使用的是虚机,只有你个NUMA节点,所以预估只开启线程池,不绑定NUMA节点应该没有什么效果。同时关闭一些不必要选项试试效果。
enable_thread_pool = on fsync = off use_workload_manager = off enable_resource_track = off enable_instr_cpu_timer = off复制
说明:使用线程池优化并不明显。
测试结果
耗时:23859.255 ms
测试结果
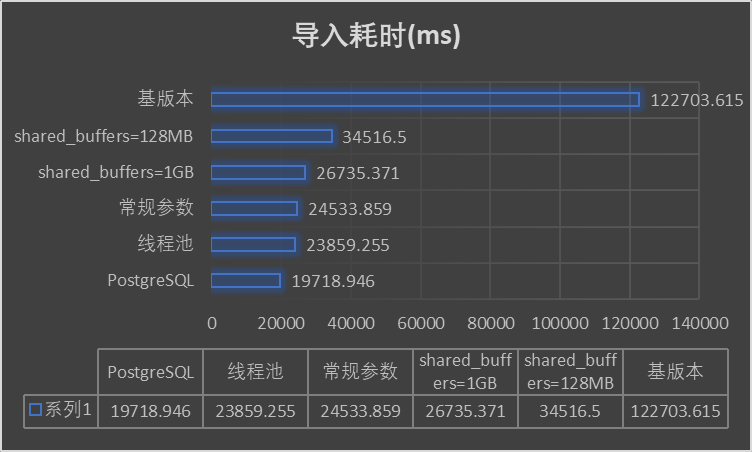
从结果上看,尽快进行了一些优化,基本上已经接近PostgreSQL的性能,但还有少许差距(最优情况是PostgreSQL的1.2倍左右)。但经过一系列的优化,最优性能是初始性能的5.14倍。主要提升是通过增大shared_buffers 来增加缓存数据,减少IO和内存交互。
总结
对于copy功能PostgreSQL从9.2.4到16devel是否有过优化?或者openGauss是否持续合并或优化PostgreSQL的copy功能,这方面我没有去考证过。单纯从测试结果上看,openGauss的copy性能要略逊于PostgreSQL。当然,可能是我水平有限,所以希望各位openGauss的专家、老师集思广益,还openGauss一个真实的COPY FROM文件导入性能。(大家可以回复优化方案,我这边去做验证)
附录
truncate bmsql_history;
\timing
copy bmsql_history from '/home/postgres/bmsql_history.csv' delimiter ',';
copy bmsql_history from '/home/omm/bmsql_history.csv' delimiter ',';
复制