


·1 前言
Prometheus是从云原生计算基金会(CNCF)毕业的项目。Prometheus是Google监控系统BorgMon类似实现的开源版,整套系统由监控服务、告警服务、时序数据库等几个部分,及周边生态的各种指标收集器(Exporter)组成,是在当下主流的监控告警系统(Prometheus官网)
exporter:广义上向prometheus提供监控数据的程序都可以成为一个exporter的,一个exporter的实例称为target, exporter来源主要2个方面,一个是社区提供的,一种是用户自定义的。
Grafana是一款采用 go 语言编写的开源应用,主要用于大规模指标数据的可视化展现,是网络架构和应用分析中最流行的时序数据展示工具,目前已经支持绝大部分常用的时序数据库。(Grafana官网)
Prometheus+Grafana 是目前较为流行的数据库监控实施方案,下面就介绍一下相关的基本部署。部署架构如下:
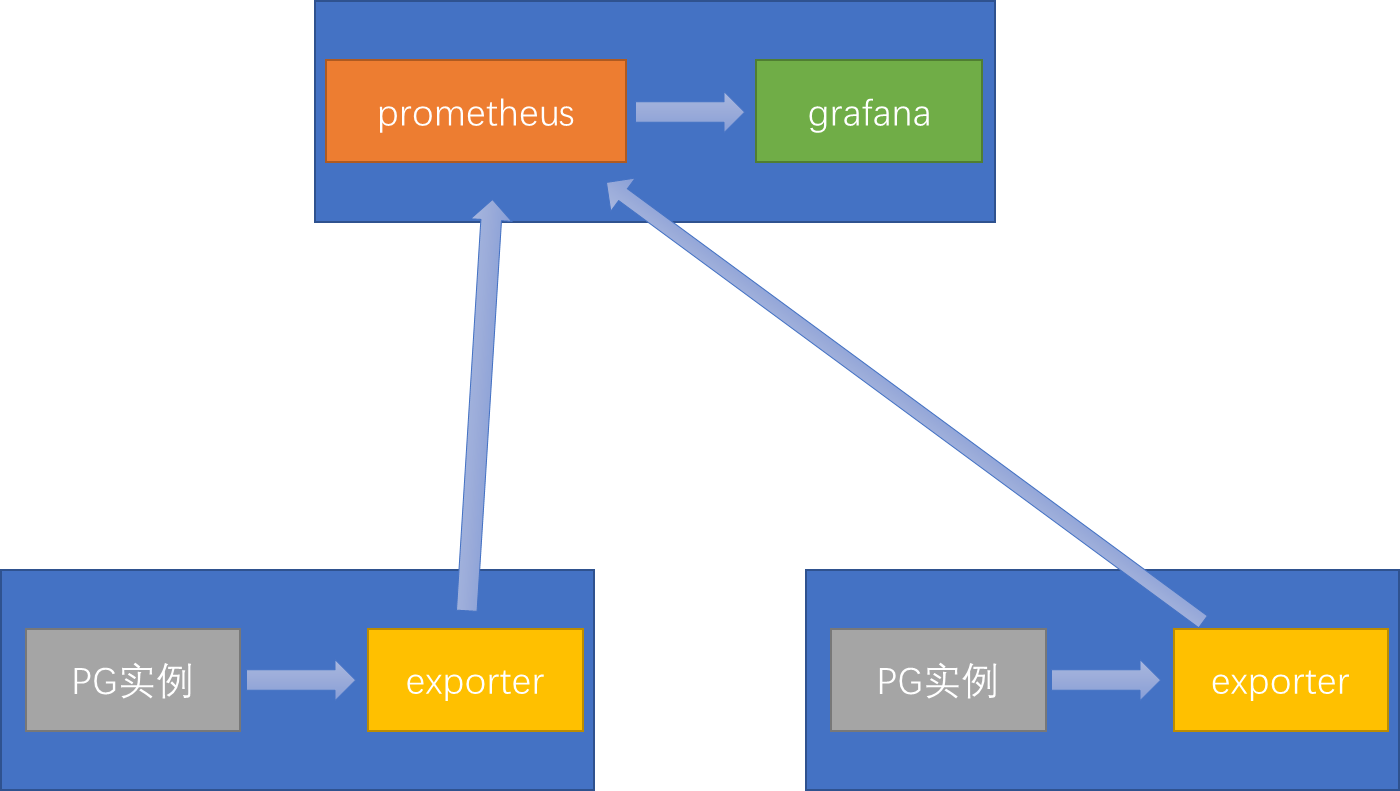
其中exporter端建议与pg部署在一起,但也可以单独部署到promethues机器。
•2 部署prometheus
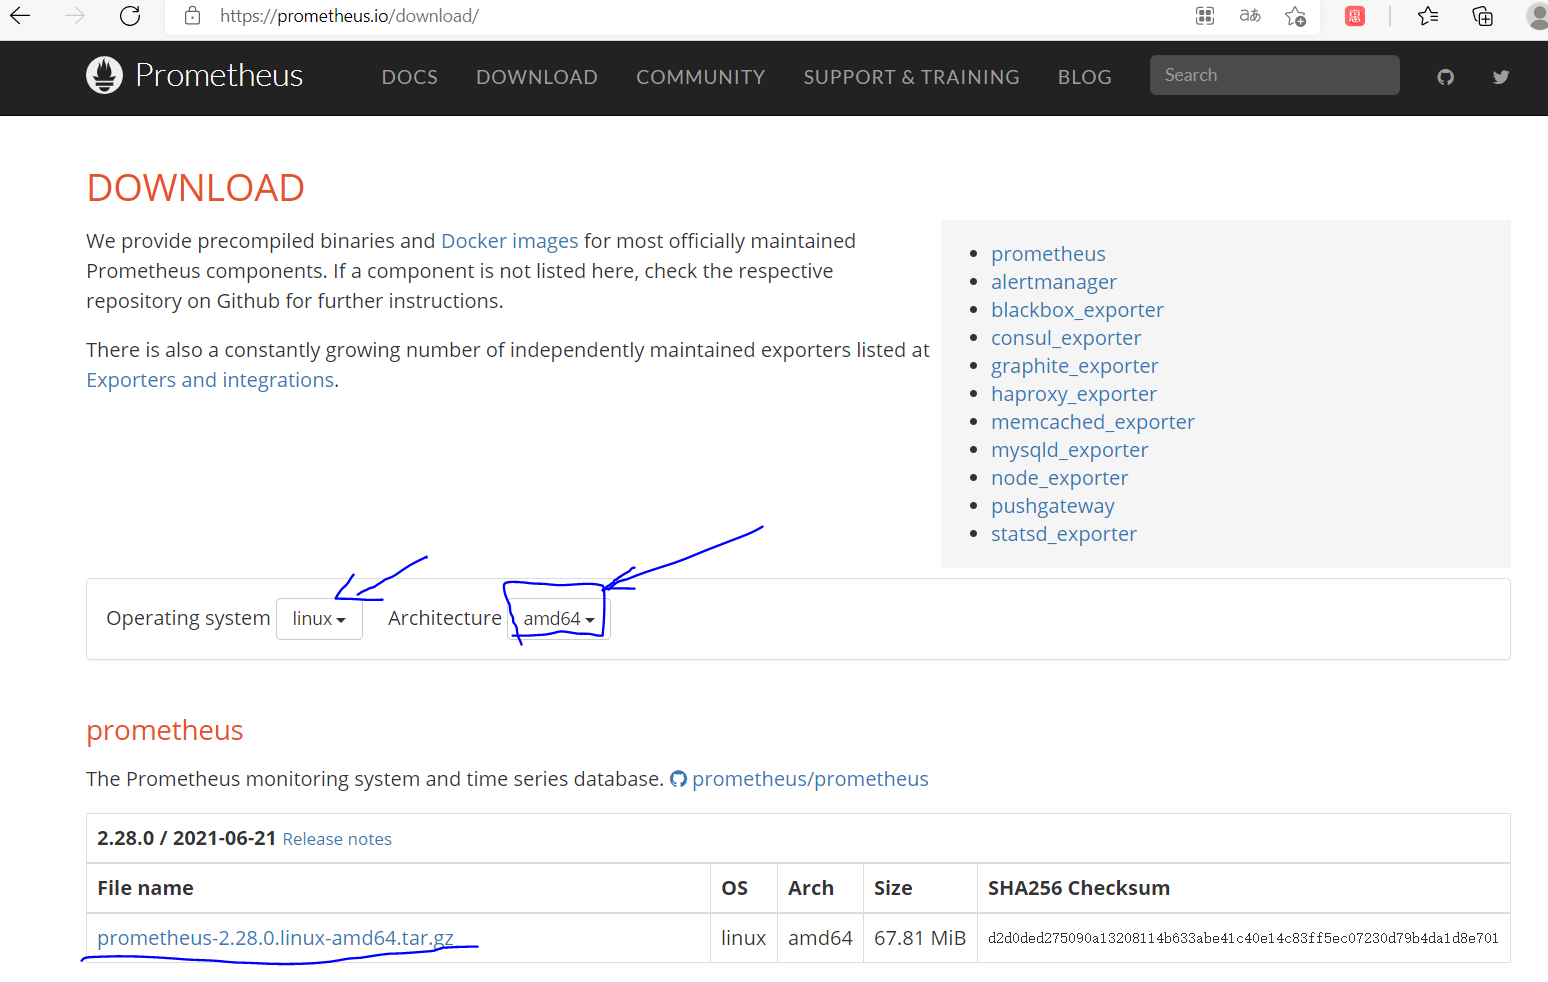
2.1,下载 https://prometheus.io/download/
2.2,添加用户prometheus
useradd prometheus;复制
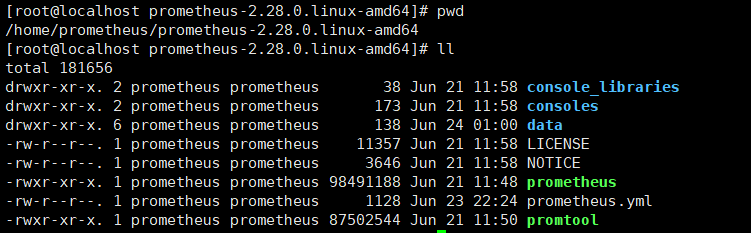
2.3,解压到:
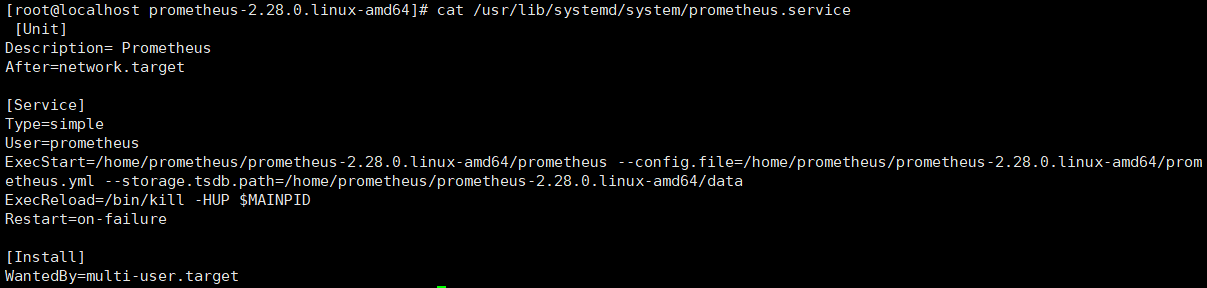
2.4,vim /usr/lib/systemd/system/prometheus.service
[Unit] Description= Prometheus After=network.target [Service] Type=simple User=prometheus ExecStart=/home/prometheus/prometheus-2.28.0.linux-amd64/prometheus --config.file=/home/prometheus/prometheus-2.28.0.linux-amd64/prometheus.yml --storage.tsdb.path=/home/prometheus/prometheus-2.28.0.linux-amd64/data ExecReload=/bin/kill -HUP $MAINPID Restart=on-failure [Install] WantedBy=multi-user.target复制
2.5, 将prometheus添加自启动;启动服务;查看状态
systemctl enable prometheus systemctl start prometheus启动服务 systemctl status prometheus服务查看服务器状态复制
2.6,开启防火墙端口9090:
firewall-cmd --zone=public --add-port=9090/tcp --permanent firewall-cmd --reload复制
•3 配置PostgreSQL
参考:https://github.com/prometheus-community/postgres_exporter
如果是新环境需要用超级用户先执行
(有可能已经在postgres数据安装了 用命令 \dx 可以查看 ):
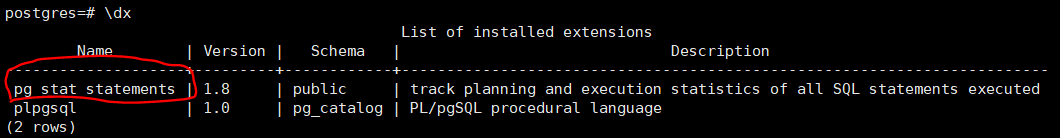
如果没有:
create extension if not exists pg_stat_statements;复制
并且在配置文件postgresql.conf 中添加:
shared_preload_libraries = 'pg_stat_statements' pg_stat_statements.max = 10000 pg_stat_statements.track = all复制
否则执行下面的sql会报错
-- To use IF statements, hence to be able to check if the user exists before -- attempting creation, we need to switch to procedural SQL (PL/pgSQL) -- instead of standard SQL. -- More: https://www.postgresql.org/docs/9.3/plpgsql-overview.html -- To preserve compatibility with <9.0, DO blocks are not used; instead, -- a function is created and dropped. CREATE OR REPLACE FUNCTION __tmp_create_user() returns void as $$ BEGIN IF NOT EXISTS ( SELECT -- SELECT list can stay empty for this FROM pg_catalog.pg_user WHERE usename = 'postgres_exporter') THEN CREATE USER postgres_exporter; END IF; END; $$ language plpgsql; SELECT __tmp_create_user(); DROP FUNCTION __tmp_create_user(); ALTER USER postgres_exporter WITH PASSWORD 'password'; ALTER USER postgres_exporter SET SEARCH_PATH TO postgres_exporter,pg_catalog; -- If deploying as non-superuser (for example in AWS RDS), uncomment the GRANT -- line below and replace <MASTER_USER> with your root user. -- GRANT postgres_exporter TO <MASTER_USER>; CREATE SCHEMA IF NOT EXISTS postgres_exporter; GRANT USAGE ON SCHEMA postgres_exporter TO postgres_exporter; GRANT CONNECT ON DATABASE postgres TO postgres_exporter; CREATE OR REPLACE FUNCTION get_pg_stat_activity() RETURNS SETOF pg_stat_activity AS $$ SELECT * FROM pg_catalog.pg_stat_activity; $$ LANGUAGE sql VOLATILE SECURITY DEFINER; CREATE OR REPLACE VIEW postgres_exporter.pg_stat_activity AS SELECT * from get_pg_stat_activity(); GRANT SELECT ON postgres_exporter.pg_stat_activity TO postgres_exporter; CREATE OR REPLACE FUNCTION get_pg_stat_replication() RETURNS SETOF pg_stat_replication AS $$ SELECT * FROM pg_catalog.pg_stat_replication; $$ LANGUAGE sql VOLATILE SECURITY DEFINER; CREATE OR REPLACE VIEW postgres_exporter.pg_stat_replication AS SELECT * FROM get_pg_stat_replication(); GRANT SELECT ON postgres_exporter.pg_stat_replication TO postgres_exporter; CREATE OR REPLACE FUNCTION get_pg_stat_statements() RETURNS SETOF pg_stat_statements AS $$ SELECT * FROM public.pg_stat_statements; $$ LANGUAGE sql VOLATILE SECURITY DEFINER; CREATE OR REPLACE VIEW postgres_exporter.pg_stat_statements AS SELECT * FROM get_pg_stat_statements(); GRANT SELECT ON postgres_exporter.pg_stat_statements TO postgres_exporter;复制
·4 部署postgres_exporter
https://github.com/wrouesnel/postgres_exporter/releases
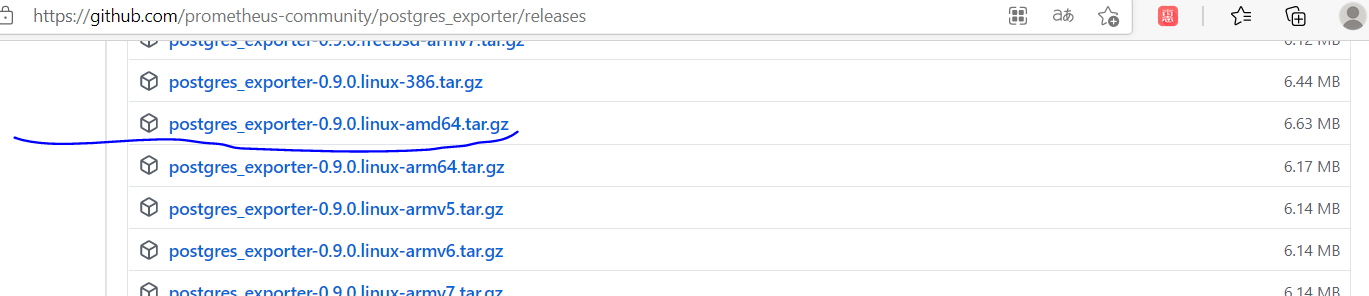
下载最新版本的linux amd64位压缩包
pg_queries.yaml在https://github.com/prometheus-community/postgres_exporter 中下载,或者使用以下内容(此内容下载的git的pg_queries.yaml 并添加了一点自己的监控指标)
pg_replication: query: "SELECT CASE WHEN NOT pg_is_in_recovery() THEN 0 ELSE GREATEST (0, EXTRACT(EPOCH FROM (now() - pg_last_xact_replay_timestamp()))) END AS lag" master: true metrics: - lag: usage: "GAUGE" description: "Replication lag behind master in seconds" pg_postmaster: query: "SELECT pg_postmaster_start_time as start_time_seconds from pg_postmaster_start_time()" master: true metrics: - start_time_seconds: usage: "GAUGE" description: "Time at which postmaster started" pg_stat_user_tables: query: | SELECT current_database() datname, schemaname, relname, seq_scan, seq_tup_read, idx_scan, idx_tup_fetch, n_tup_ins, n_tup_upd, n_tup_del, n_tup_hot_upd, n_live_tup, n_dead_tup, n_mod_since_analyze, COALESCE(last_vacuum, '1970-01-01Z') as last_vacuum, COALESCE(last_autovacuum, '1970-01-01Z') as last_autovacuum, COALESCE(last_analyze, '1970-01-01Z') as last_analyze, COALESCE(last_autoanalyze, '1970-01-01Z') as last_autoanalyze, vacuum_count, autovacuum_count, analyze_count, autoanalyze_count FROM pg_stat_user_tables metrics: - datname: usage: "LABEL" description: "Name of current database" - schemaname: usage: "LABEL" description: "Name of the schema that this table is in" - relname: usage: "LABEL" description: "Name of this table" - seq_scan: usage: "COUNTER" description: "Number of sequential scans initiated on this table" - seq_tup_read: usage: "COUNTER" description: "Number of live rows fetched by sequential scans" - idx_scan: usage: "COUNTER" description: "Number of index scans initiated on this table" - idx_tup_fetch: usage: "COUNTER" description: "Number of live rows fetched by index scans" - n_tup_ins: usage: "COUNTER" description: "Number of rows inserted" - n_tup_upd: usage: "COUNTER" description: "Number of rows updated" - n_tup_del: usage: "COUNTER" description: "Number of rows deleted" - n_tup_hot_upd: usage: "COUNTER" description: "Number of rows HOT updated (i.e., with no separate index update required)" - n_live_tup: usage: "GAUGE" description: "Estimated number of live rows" - n_dead_tup: usage: "GAUGE" description: "Estimated number of dead rows" - n_mod_since_analyze: usage: "GAUGE" description: "Estimated number of rows changed since last analyze" - last_vacuum: usage: "GAUGE" description: "Last time at which this table was manually vacuumed (not counting VACUUM FULL)" - last_autovacuum: usage: "GAUGE" description: "Last time at which this table was vacuumed by the autovacuum daemon" - last_analyze: usage: "GAUGE" description: "Last time at which this table was manually analyzed" - last_autoanalyze: usage: "GAUGE" description: "Last time at which this table was analyzed by the autovacuum daemon" - vacuum_count: usage: "COUNTER" description: "Number of times this table has been manually vacuumed (not counting VACUUM FULL)" - autovacuum_count: usage: "COUNTER" description: "Number of times this table has been vacuumed by the autovacuum daemon" - analyze_count: usage: "COUNTER" description: "Number of times this table has been manually analyzed" - autoanalyze_count: usage: "COUNTER" description: "Number of times this table has been analyzed by the autovacuum daemon" pg_statio_user_tables: query: "SELECT current_database() datname, schemaname, relname, heap_blks_read, heap_blks_hit, idx_blks_read, idx_blks_hit, toast_blks_read, toast_blks_hit, tidx_blks_read, tidx_blks_hit FROM pg_statio_user_tables" metrics: - datname: usage: "LABEL" description: "Name of current database" - schemaname: usage: "LABEL" description: "Name of the schema that this table is in" - relname: usage: "LABEL" description: "Name of this table" - heap_blks_read: usage: "COUNTER" description: "Number of disk blocks read from this table" - heap_blks_hit: usage: "COUNTER" description: "Number of buffer hits in this table" - idx_blks_read: usage: "COUNTER" description: "Number of disk blocks read from all indexes on this table" - idx_blks_hit: usage: "COUNTER" description: "Number of buffer hits in all indexes on this table" - toast_blks_read: usage: "COUNTER" description: "Number of disk blocks read from this table's TOAST table (if any)" - toast_blks_hit: usage: "COUNTER" description: "Number of buffer hits in this table's TOAST table (if any)" - tidx_blks_read: usage: "COUNTER" description: "Number of disk blocks read from this table's TOAST table indexes (if any)" - tidx_blks_hit: usage: "COUNTER" description: "Number of buffer hits in this table's TOAST table indexes (if any)" pg_database: query: "SELECT pg_database.datname, pg_database_size(pg_database.datname) as size_bytes FROM pg_database" master: true cache_seconds: 30 metrics: - datname: usage: "LABEL" description: "Name of the database" - size_bytes: usage: "GAUGE" description: "Disk space used by the database" pg_stat_statements: query: "SELECT t2.rolname, t3.datname, queryid, calls, total_time / 1000 as total_time_seconds, min_time / 1000 as min_time_seconds, max_time / 1000 as max_time_seconds, mean_time / 1000 as mean_time_seconds, stddev_time / 1000 as stddev_time_seconds, rows, shared_blks_hit, shared_blks_read, shared_blks_dirtied, shared_blks_written, local_blks_hit, local_blks_read, local_blks_dirtied, local_blks_written, temp_blks_read, temp_blks_written, blk_read_time / 1000 as blk_read_time_seconds, blk_write_time / 1000 as blk_write_time_seconds FROM pg_stat_statements t1 JOIN pg_roles t2 ON (t1.userid=t2.oid) JOIN pg_database t3 ON (t1.dbid=t3.oid) WHERE t2.rolname != 'rdsadmin'" master: true metrics: - rolname: usage: "LABEL" description: "Name of user" - datname: usage: "LABEL" description: "Name of database" - queryid: usage: "LABEL" description: "Query ID" - calls: usage: "COUNTER" description: "Number of times executed" - total_time_seconds: usage: "COUNTER" description: "Total time spent in the statement, in milliseconds" - min_time_seconds: usage: "GAUGE" description: "Minimum time spent in the statement, in milliseconds" - max_time_seconds: usage: "GAUGE" description: "Maximum time spent in the statement, in milliseconds" - mean_time_seconds: usage: "GAUGE" description: "Mean time spent in the statement, in milliseconds" - stddev_time_seconds: usage: "GAUGE" description: "Population standard deviation of time spent in the statement, in milliseconds" - rows: usage: "COUNTER" description: "Total number of rows retrieved or affected by the statement" - shared_blks_hit: usage: "COUNTER" description: "Total number of shared block cache hits by the statement" - shared_blks_read: usage: "COUNTER" description: "Total number of shared blocks read by the statement" - shared_blks_dirtied: usage: "COUNTER" description: "Total number of shared blocks dirtied by the statement" - shared_blks_written: usage: "COUNTER" description: "Total number of shared blocks written by the statement" - local_blks_hit: usage: "COUNTER" description: "Total number of local block cache hits by the statement" - local_blks_read: usage: "COUNTER" description: "Total number of local blocks read by the statement" - local_blks_dirtied: usage: "COUNTER" description: "Total number of local blocks dirtied by the statement" - local_blks_written: usage: "COUNTER" description: "Total number of local blocks written by the statement" - temp_blks_read: usage: "COUNTER" description: "Total number of temp blocks read by the statement" - temp_blks_written: usage: "COUNTER" description: "Total number of temp blocks written by the statement" - blk_read_time_seconds: usage: "COUNTER" description: "Total time the statement spent reading blocks, in milliseconds (if track_io_timing is enabled, otherwise zero)" - blk_write_time_seconds: usage: "COUNTER" description: "Total time the statement spent writing blocks, in milliseconds (if track_io_timing is enabled, otherwise zero)" pg_process_idle: query: | WITH metrics AS ( SELECT application_name, SUM(EXTRACT(EPOCH FROM (CURRENT_TIMESTAMP - state_change))::bigint)::float AS process_idle_seconds_sum, COUNT(*) AS process_idle_seconds_count FROM pg_stat_activity WHERE state = 'idle' GROUP BY application_name ), buckets AS ( SELECT application_name, le, SUM( CASE WHEN EXTRACT(EPOCH FROM (CURRENT_TIMESTAMP - state_change)) <= le THEN 1 ELSE 0 END )::bigint AS bucket FROM pg_stat_activity, UNNEST(ARRAY[1, 2, 5, 15, 30, 60, 90, 120, 300]) AS le GROUP BY application_name, le ORDER BY application_name, le ) SELECT application_name, process_idle_seconds_sum as seconds_sum, process_idle_seconds_count as seconds_count, ARRAY_AGG(le) AS seconds, ARRAY_AGG(bucket) AS seconds_bucket FROM metrics JOIN buckets USING (application_name) GROUP BY 1, 2, 3 metrics: - application_name: usage: "LABEL" description: "Application Name" - seconds: usage: "HISTOGRAM" description: "Idle time of server processes" pg_active_lockedsql: query: | select case when replace(replace(pg_blocking_pids(pid)::text,'{',''),'}','')='' then 'numsofnopidblock' else 'numsofsomepidblock' end pidblock, count(1) pidnums from pg_stat_activity where state not in('idle') and query !='' group by pidblock order by pidblock; metrics: - pidblock: usage: "LABEL" description: "Possible values:numsofnopidblock--The processes that are not locked; numsofsomepidblock--The processes locked by some " - pidnums: usage: "COUNTER" description: "The number of processes" pg_active_slowsql: query: | select datname,usename,count(1) slowsql_count from pg_stat_activity where state not in('idle') and query !='' and extract(epoch from (now() - query_start)) > 60*5 group by datname,usename order by count(1) desc; metrics: - datname: usage: "LABEL" description: "Name of database" - usename: usage: "LABEL" description: "Name of user" - slowsql_count: usage: "COUNTER" description: "the numbers of slow sqls" pg_never_used_indexes: query: | select pi.schemaname, pi.relname, pi.indexrelname, pg_table_size(pi.indexrelid) as index_size from pg_indexes pis join pg_stat_user_indexes pi on pis.schemaname = pi.schemaname and pis.tablename = pi.relname and pis.indexname = pi.indexrelname left join pg_constraint pco on pco.conname = pi.indexrelname and pco.conrelid = pi.relid where pco.contype is distinct from 'p' and pco.contype is distinct from 'u' and (idx_scan,idx_tup_read,idx_tup_fetch) = (0,0,0) and pis.indexdef !~ ' UNIQUE INDEX ' and pi.relname !~ 'backup$' order by pg_table_size(indexrelid) desc; metrics: - schemaname: usage: "LABEL" description: "Schema of table" - relname: usage: "LABEL" description: "Name of table" - indexrelname: usage: "LABEL" description: "Name of index" - index_size: usage: "GAUGE" description: "Size of index" pg_tablelocktops: query: | select db.datname,relname tbname,mode locktype,count(1) locknums from pg_database db join pg_locks lk on db.oid=lk.database join pg_class cl on lk.relation=cl.oid join pg_stat_activity act on lk.pid=act.pid where db.datname not in ('template0','template1') and fastpath='t' and cl.oid not in (select oid from pg_class where relname in ('pg_class','pg_locks')) and act.pid <>pg_backend_pid() and cl.reltablespace in (select oid from pg_tablespace) group by db.datname,relname,mode order by count(1) desc limit 10; metrics: - datname: usage: "LABEL" description: "database of table" - tbname: usage: "LABEL" description: "Name of table" - locktype: usage: "LABEL" description: "type of lock" - locknums: usage: "COUNTER" description: "the numbers of this lock"复制
**注1:**这个pg_exporter最好与PostgreSQL放在同一个服务器方便后续配置。
**注2:**尽量不要使用root用户运行,而是采用postgres用户或者别的适当用户。
**注3:**在需要新增监控指标的参数添加时一定要参照git上的pg_queries.yaml格式进行修改(包括缩进等,最好就是复制原有的再进行修改,postgres_exporter在这里执行的非常严格,最开始配置的时候我在这里调了不少时间)
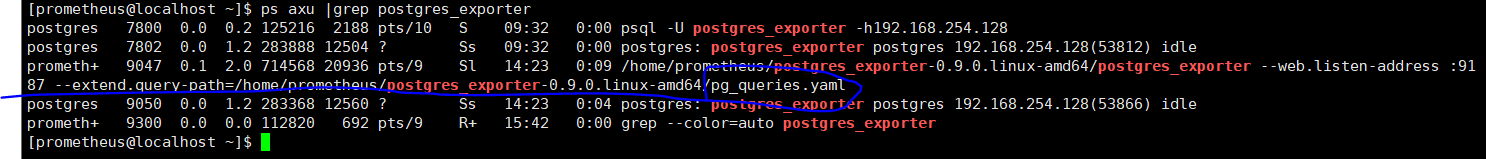
[prometheus@localhost ~]$ /home/prometheus/postgres_exporter-0.9.0.linux-amd64/postgres_exporter --web.listen-address :9187 --extend.query-path="/home/prometheus/postgres_exporter-0.9.0.linux-amd64/pg_queries.yaml" &复制
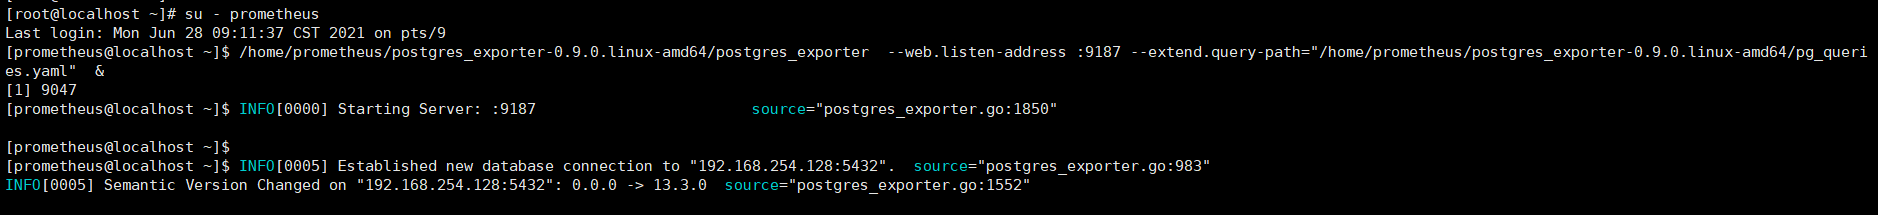
登录 192.168.254.128:9187/metrics 查看相关postgres_exporter发送的相关数据,(如果有新增的参数的话,可以搜索一下,看是否有添加成功)
部署完成postgres_exporter之后登陆 192.168.254.128:9187/metrics 刷新,启动进程的session没有报错,就是成功了的
·5 配置 prometheus
这一步骤,是要让prometheus去接收postgres_exporter的数据。
修改prometheus.yaml配置文件如下:
global: alerting: alertmanagers: - static_configs: - targets: rule_files: scrape_configs: - job_name: 'prometheus' static_configs: - targets: ['0.0.0.0:9090'] - job_name: 'postgresql-instancetest' static_configs: - targets: ['192.168.254.128:9187','192.168.254.129:9187']复制
主要配置的是scrape_configs下属配置。
每个需要监控的postgres_exporter实例,是一个单独的job_name,并配置job名称,以及job的连接参数(机器:端口)
然后重启服务
systemctl restart prometheus复制
·6 部署 grafana
与前面说的go系列程序不同,grafana是nodejs的产物,因此没办法做到一个bin文件形态的部署,建议根据操作系统,选择对应的安装办法:
https://grafana.com/grafana/download
Red Hat, CentOS, RHEL, and Fedora(64 Bit)
wget https://dl.grafana.com/oss/release/grafana-8.0.3-1.x86_64.rpm sudo yum install grafana-8.0.3-1.x86_64.rpm复制
安装完成后,设置开机自启动,并启动服务:
systemctl enable grafana-server systemctl start grafana-server systemctl status grafana-server复制
默认监听端口为3000端口,默认用户名密码为admin/admin,第一次登陆需要修改密码。

开放3000端口的防火墙
firewall-cmd --zone=public --add-port=3000/tcp --permanent firewall-cmd --reload复制
·7 配置 grafana
这一部分是最终配置grafana页面。首先是配置数据源(假设部署在192.168.254.128机器):
从 http://192.168.254.128:3000/datasources 页面添加Prometheus数据源:在http url处写入http://:9090,(如果有需要)输入其他安全认证类参数。
导入监控模板

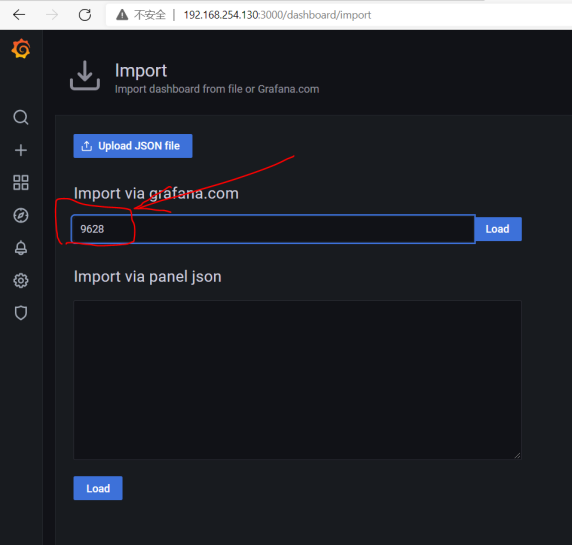
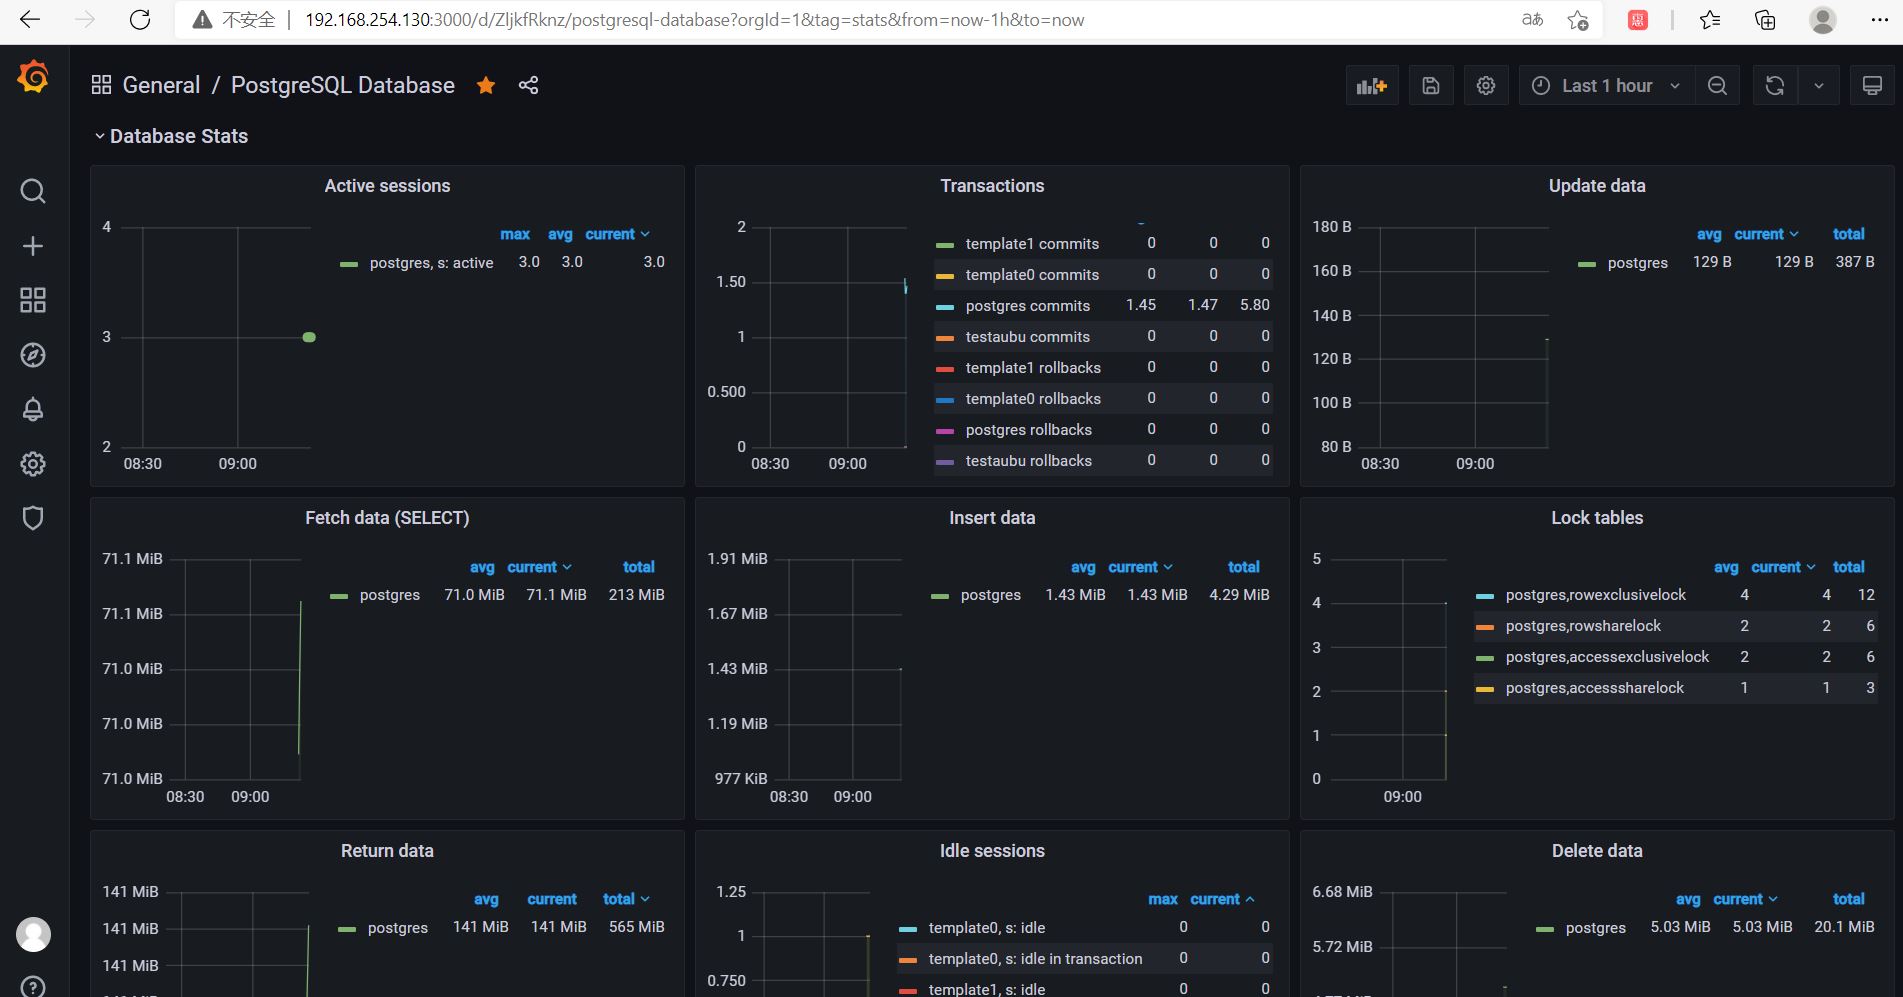
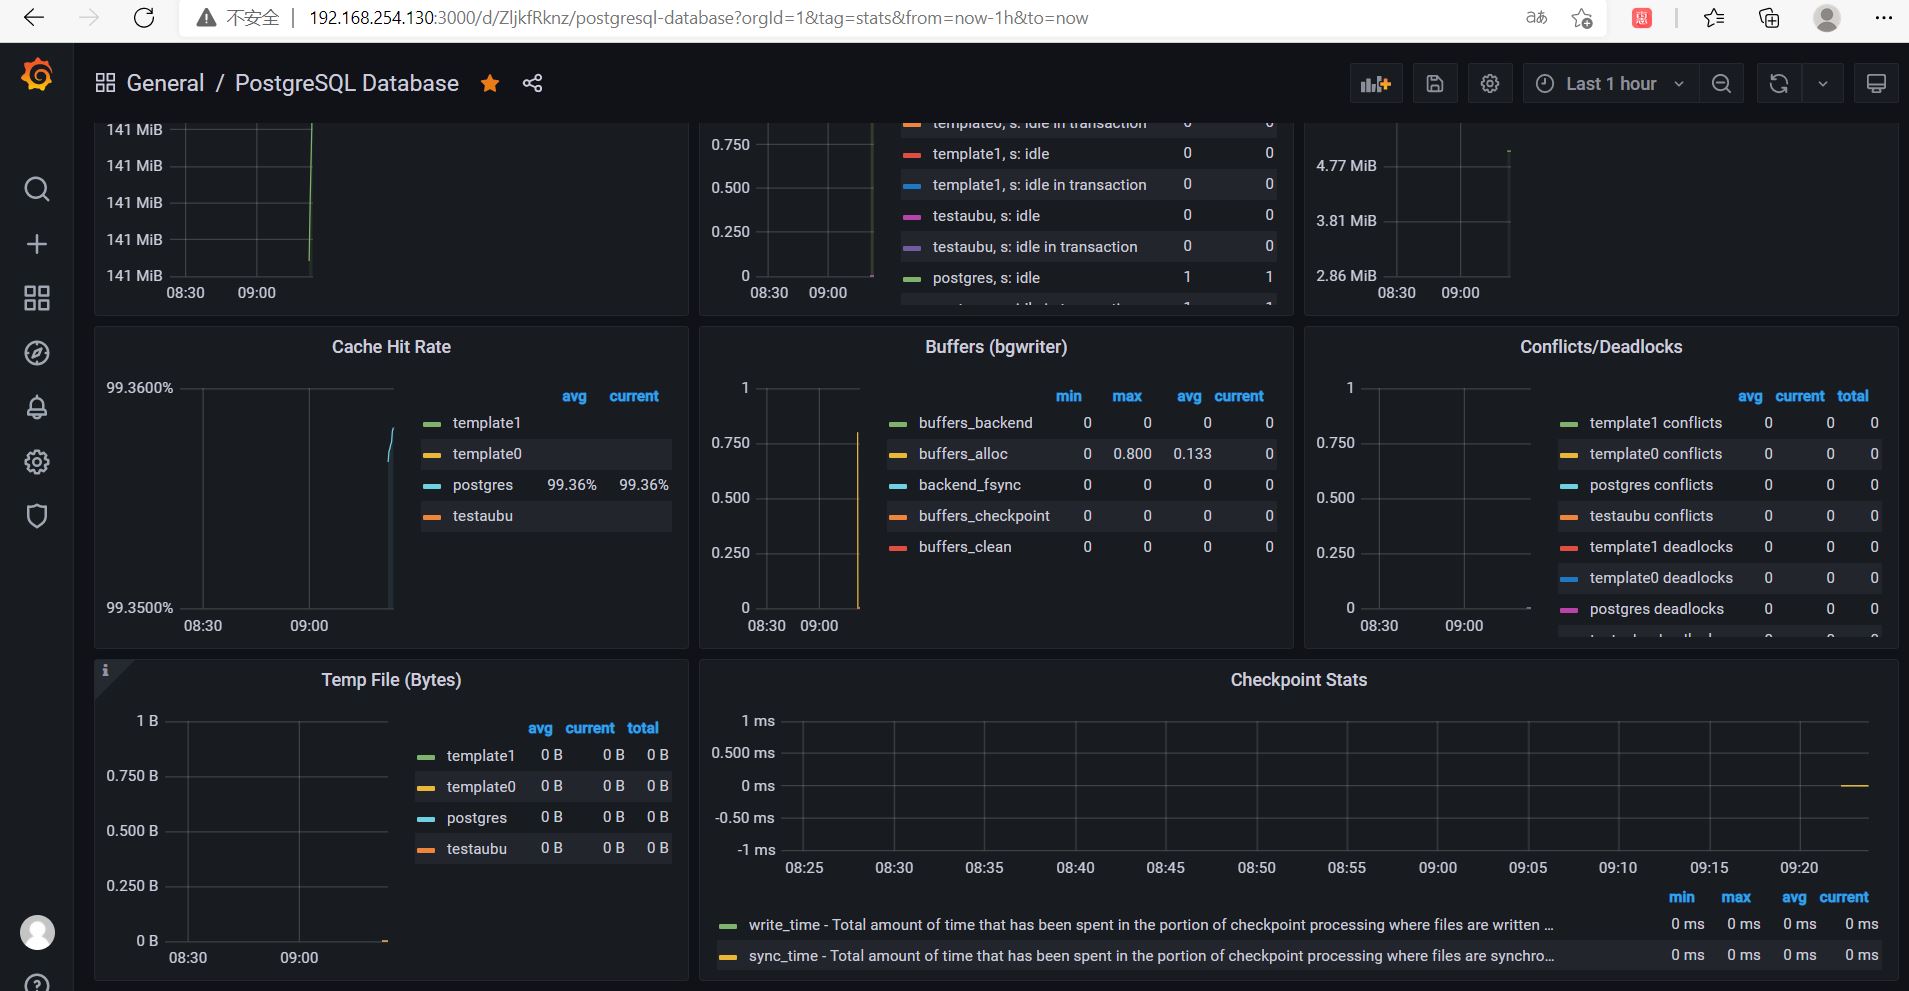
9628号模板即PostgreSQL Database的dashboard:https://grafana.com/grafana/dashboards/9628
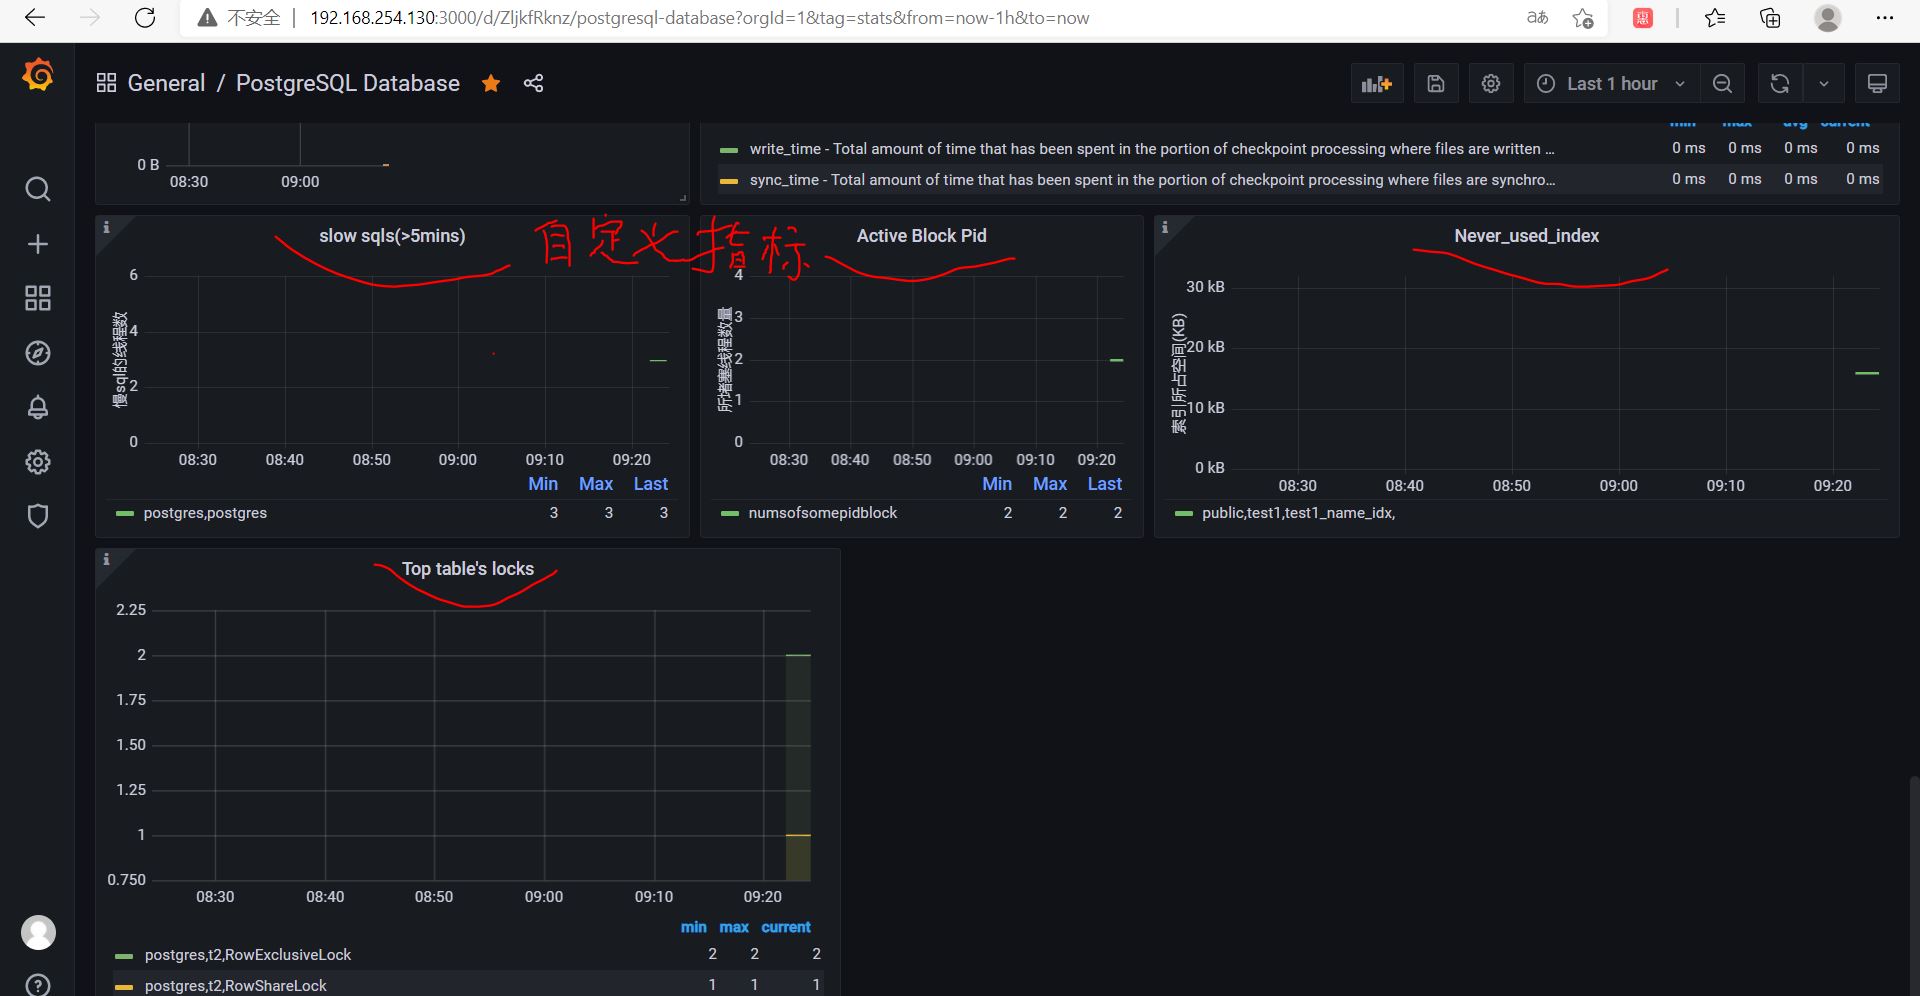
·8 新增监控指标:
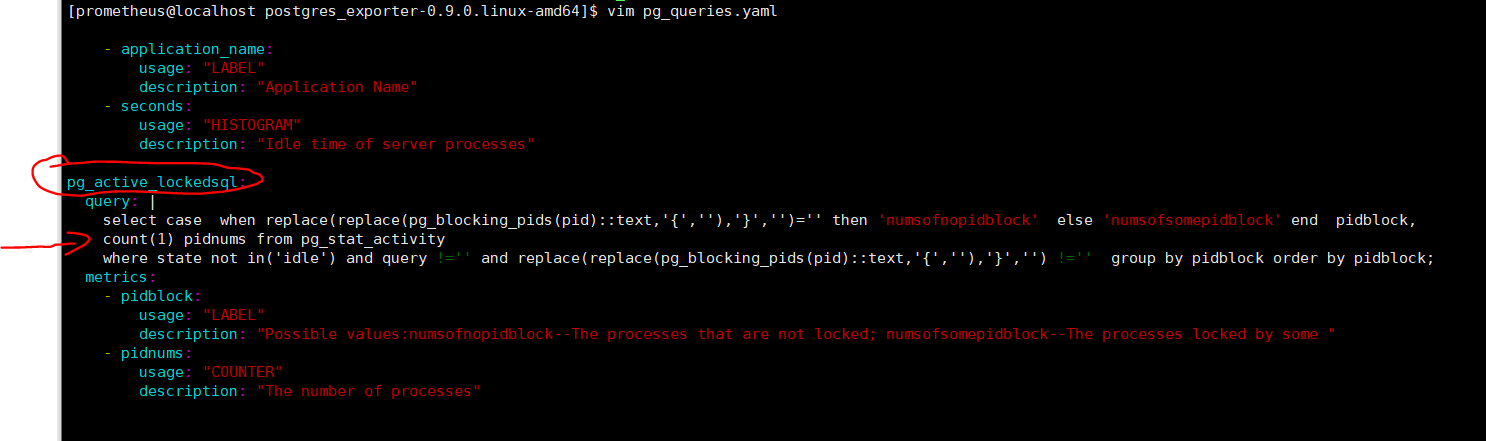
8.1
首先需要在postgres_exporter端的pg_queries.yaml中加入该监控指标的查询sql
例如:
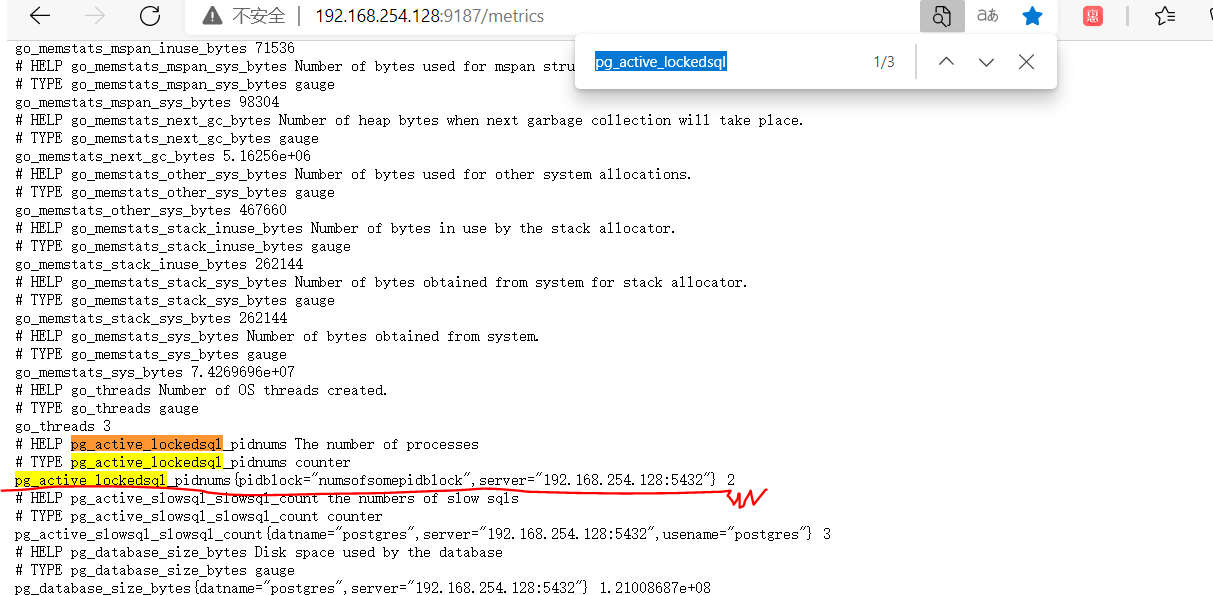
8.2
然后在192.168.254.128:9187/metrics中查看是否有相关的参数输出:
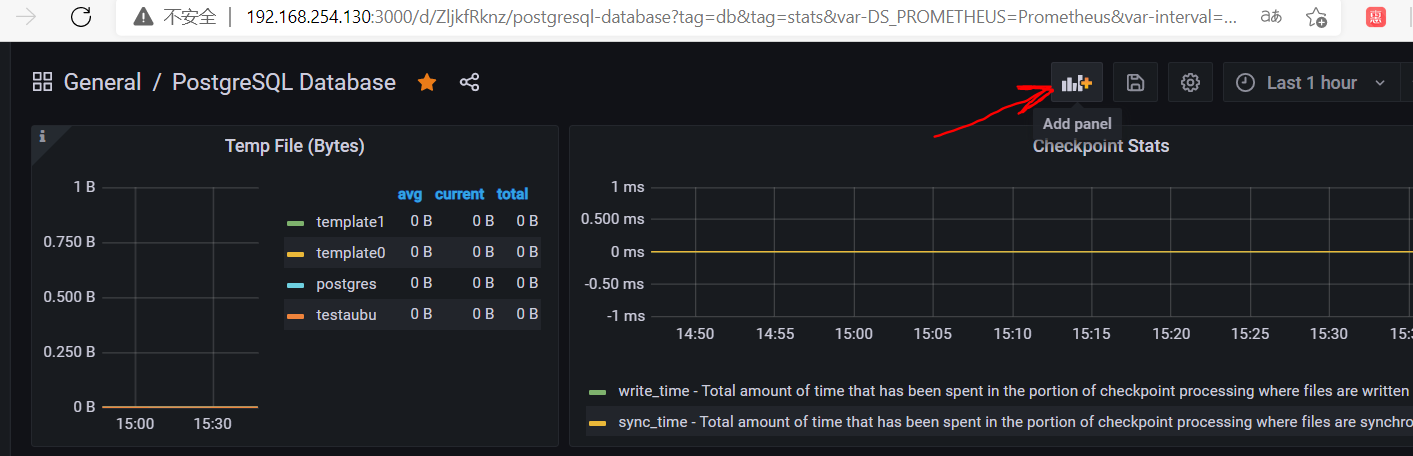
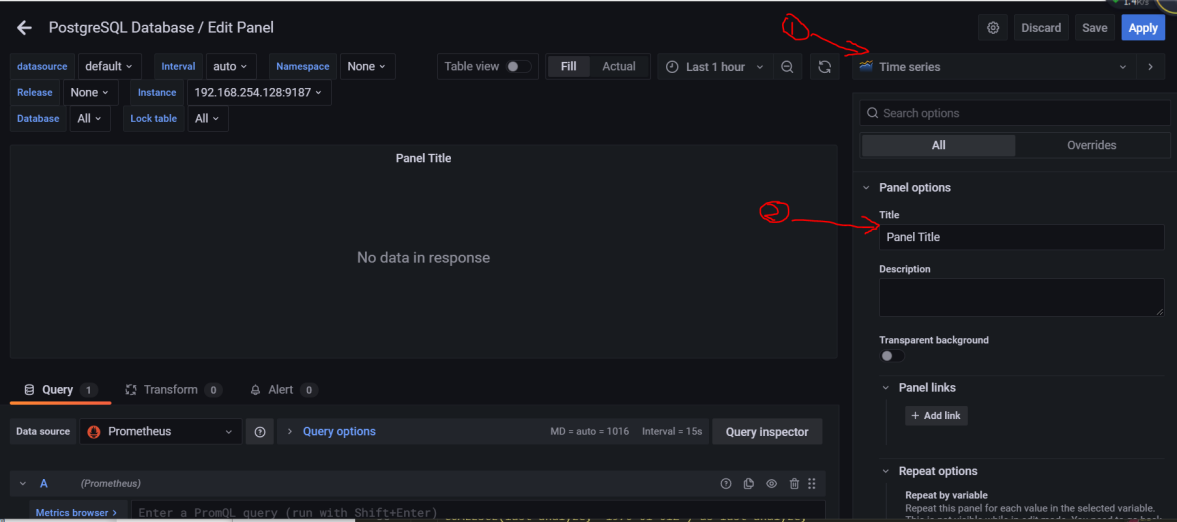
8.3 在Grafana中添加panel :
8.3.1 点击添加
8.3.2 选择图标展示类型,以及标题等
8.3.3 依次选择和键入相关内容;
instance="instance" 这个是对我们所建立的实例,意思是遍历我们设置的实例
dataname=~"datname"这个参数是设置所传入的database的名字(如果需要的话);不同的设置之间用”,”间隔。
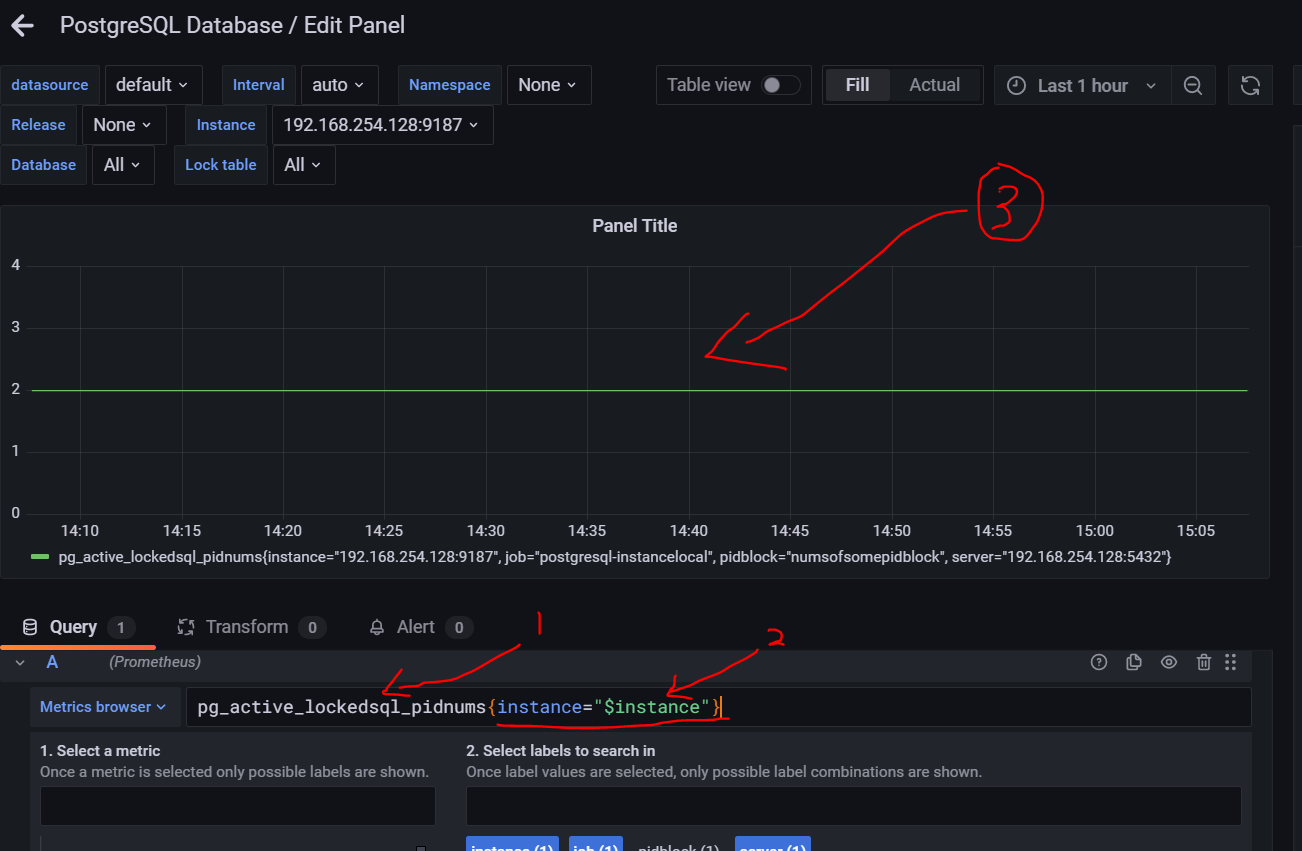
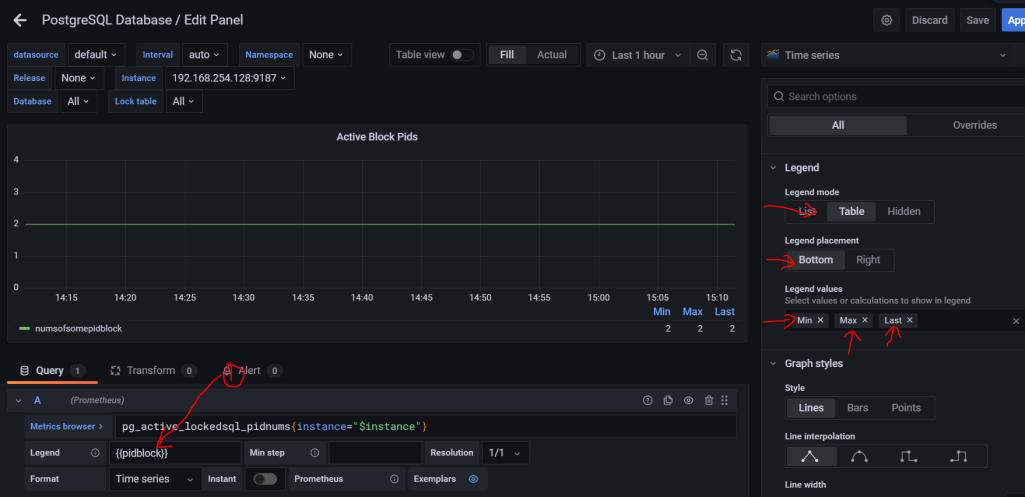
上图中1的位置是设置需要显示在图例中的相关参数值,这个值是取自8.2中讲到的相关数字
设置好之后就会又数据展示出来,然后保存即可
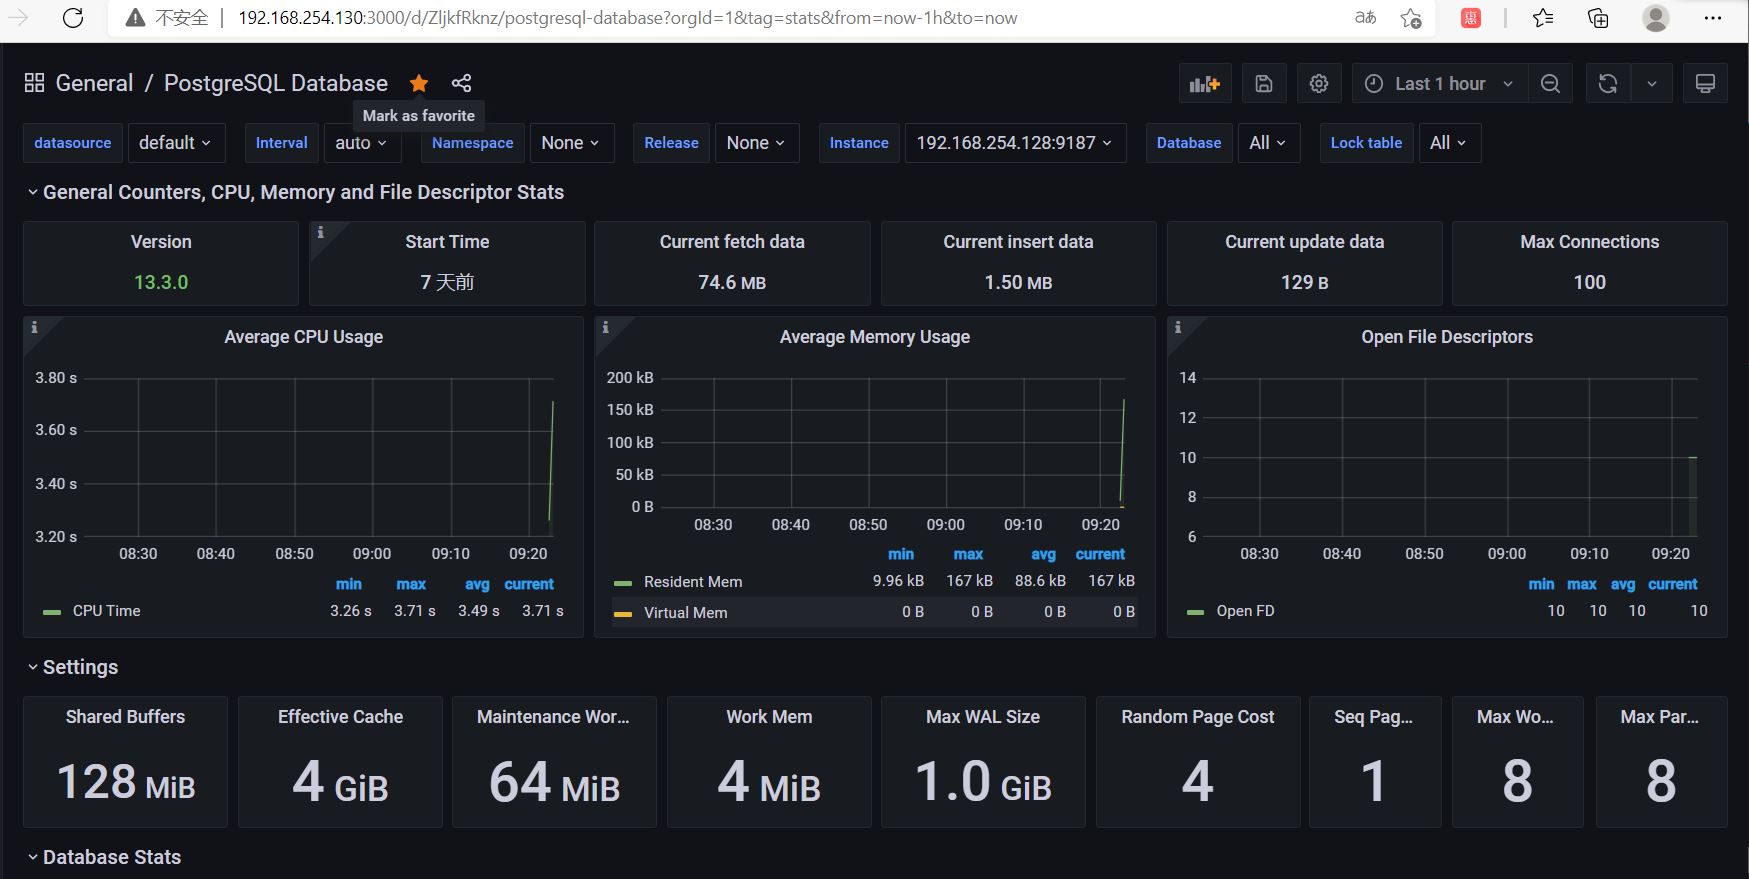
最后效果图:
评论

 0 点赞
0 点赞 0 点赞 0 点赞 0 点赞