


ADF2T: an Active Disk Failure Forecasting and Tolerance Software.pdf
免费下载

ADF2T: an Active Disk Failure Forecasting and Tolerance Software
Hongzhang Yang
†‡
, Yahui Yang
ѽ
†
, Zhengguang Chen
‡
, Zongzhao Li
‡
and Yaofeng Tu
ѽ
‡§
†
School of Software & Microelectronics, Peking University, China
‡
ZTE Corporation, China
§
State Key Laboratory of Mobile Network and Mobile Multimedia Technology, China
*Corresponding author: Yahui Yang(yhyang@ss.pku.edu.cn), Yaofeng Tu(tu.yaofeng@zte.com.cn)
Abstract—The reliability of distributed file system is
inevitably affected by hard disk failure. This paper proposes an
active disk failure forecasting and tolerance software. Firstly,
multiple SMART records in the time window are merged into
one sample, and after sliding, tens of times of positive samples
are created.
Secondly
, the features are selected by two-stage
sorting method, so that the most conducive features are used in
machine learning modeling, and the time for model training can
be shortened obviously. Thirdly, through two-stage verification,
parameters can be adjusted in time for unreasonable proactive
reconstruction strategies. Experiments show that modeling and
forecast of ZTE data set and Backblaze data set respectively, the
recall rate is 95.66% and 84.28%, and the error rate is 0.23%
and 2.45%. The work in this paper has been commercially used
for more than one year in ZTE data center. The reliability of
distributed file system software is significantly improved.
Keywords—reliability; disk; failure; forecast
I. INTRODUCTION
As a typical large-scale software system, the reliability of
distributed file system is inevitably affected by hardware
failure, especially hard disk failure. According to the IDC
white paper [1], the data all over the world will reach 175ZB
by the year of 2025. Currently, the annual failure rate of disks
is about 1% [2]. So, hundreds of millions of failure disks will
appear each year worldwide soon. It is undeniable that disk
failure has become the main failure source in data center [3].
According to the survey results provided by ZTE Corporation,
among all the failures in the ZTE data center in 2019, disk
failures accounted for more than half, namely 53.49%.
Similarly, in other research works, this number was 71.1% [4]
and 49.1% [2]. Disk failure can directly lead to disastrous
consequences, such as data loss and business interruption.
In the traditional distributed file systems, it is data
redundancy that mainly ensures reliability, including replica,
erasure code, snapshot, and so on. After disks failed, these
technologies rely on redundancy to ensure read-write
operations and data recovery, so all of them are passive
processing technologies. The defects are as follows: 1) when
the number of failed disks is more than the number of
redundant disks, the risk of permanent data loss is
significantly; 2) in the process of data recovery, system
resources are inevitably occupied by data recovery; 3)
redundancy takes up extra storage space, which leads to the
increase of cos
t. Different from above technologies, this
paper proposes an active disk fault-tolerance technology, that
is, by forecasting disk failure, it provides possibility to
migrate data in advance, as a result the reliability of the
distributed file system is ensured.
A microcosmic view to disk failure, is just as human
beings experience “healthy, sub-healthy, illness, and death”
in their own lifetimes, disk individuals also experience
"healthy, sub-healthy, near-failure, and failure" inevitably.
This is because of the wear of various hardware components.
At the same time, similar to human death due to congenital
physical defects, and accidental deaths caused by accidents
such as car accidents, earthquakes, disasters, animal attacks,
etc. Disks also have unforecastable failures caused by
manufacturing defects or accidental failures, such as
formaldehyde, vibration, sudden voltage changes, excessive
air humidity, and so on. Obviously, the inevitable failure of
the disk has a near-term failure window period, which has the
possibility of forecast, but the accidental failure of the disk is
often sudden, and there is absolutely no near-failure window
period, so it is not forecastable. Considering ZTE's
experience in datacenter operation, this paper gives the
definition of each state of disk as:
x The healthy state, is that the disk can correctly
perform operations such as mount, read, write, and the
operation response time meets the specifications of
the disk manufacturer's manual, and the disk SMART
(Self-Monitoring Analysis and Reporting Technology)
[5] result is normal.
x The sub-healthy state, is that the disk occasionally
freezes, and the response time of operations such as
mount, read, and write does not meet the
specifications of the disk manufacturer's manual
occasionally, and the SMART result of the disk are
slightly abnormal.
x The near-failure state, is one or more of the following
conditions on the disk: mechanical noise, severe
abnormality of the SMART result of the disk, data
loss, read or write incompletely, read or write slowly,
frequent offline, and high temperature, among which
read or write slowly is the most common. That is, the
waiting time of read or write requests in the queue for
20 consecutive times exceeds 1.5 seconds.
x The failure state, is one or more of the following
conditions: file system log printing Medium Error, IO
Error, critical target error, Metadata IO Error, mount
failed, no response to read or write, etc.
The disk failure forecast technology is to find the trends
that the disk is on the near-failure state, thereby forecasting
that the disk will become failure state in the foreseeable
future, for example 7 days.
13
2020 IEEE International Symposium on Software Reliability Engineering Workshops (ISSREW)
978-1-7281-7735-9/20/$31.00 ©2020 IEEE
DOI 10.1109/ISSREW51248.2020.00030
Authorized licensed use limited to: ZTE CORPORATION. Downloaded on July 26,2023 at 12:22:01 UTC from IEEE Xplore. Restrictions apply.
II. MOTIVATION
In 2001, Greg Hamerly [6] tried to forecast disk failure
through machine learning, and gave a standard process to
solve this problem. Firstly, gathering disk SMART or IO
information, and then training both the healthy and the failure
samples until a model is able to classify the disk from the two
states. In recent years, disk failure forecast has quickly
become a research hotspot, and many research results have
achieved the accuracy rate of more than 85% for single-brand
SATA disk failure forecast.
Although the related works has continuously improved
the accuracy of failure forecast, there are still many problems
in commercial scenario.
x Positive and negative samples are severely
unbalanced. The biggest obstacle of disk failure in the
research at this stage is the small number of failure
disks, as well as the huge number of healthy disks.
Although positive samples can be increased by over-
sampling techniques, it will cause overfitting
problems. Although negative samples can be reduced
through under
-sampling techniques, it will cause
information loss. Therefore, a new balancing method
is urgently needed.
x It is difficult to obtain high accuracy and low error
rate at the same time. We believe that this is caused
by both the data for training and the algorithm for
training. In terms of data, feature selection is required
to remove interference or irrelevant features.
x The feedback mechanism of forecast is needed to be
established urgently. There are three types of
forecast
errors: misjudgment, omissions, and delayed
judgement. misjudgment wastes the remaining life
span of the disk. Omissions and delayed judgement
cause the system to enter a degraded state and rely on
traditional fault tolerance to ensure reliability. When
a forecast error occurs, it is often that corrects it by
updating the forecast model. However, this method
has a time lag, so a more flexible feedback
mechanism is needed.
To overcome the above shortcomings, this paper proposes
ADF2T, an active disk failure forecasting and tolerance
software, including:
x A sliding window record merging technology was
proposed to solve the problem of severe unbalance of
positive and negative samples.
x A two-stage feature selection technology is proposed
to obtain forecast results with high accuracy and low
error rate.
x A two-stage verification technology is proposed to
flexibly and quickly deal with misjudgments,
omissions, and delayed judgment.
III. D
ESIGN OF ADF2T
This chapter analyzes and studies the disk situation of a
video-oriented data center of ZTE, and propose a disk failure
forecast software, covering gathering stage, modeling stage,
and reconstructing stage. The data center has 129,887 disks
totally, and 1,995 failed disks appeared during the year of
2018. For each disk,
SMART is gathered once an hour
without peak hours, so there are 16 records every day.
A. Sliding window record merging technology
In the ZTE data center, the ratio of healthy disks to failed
disks is about 64:1. Facing the severe unbalance between the
positive and negative samples, we propose a sliding window
record merging technology.
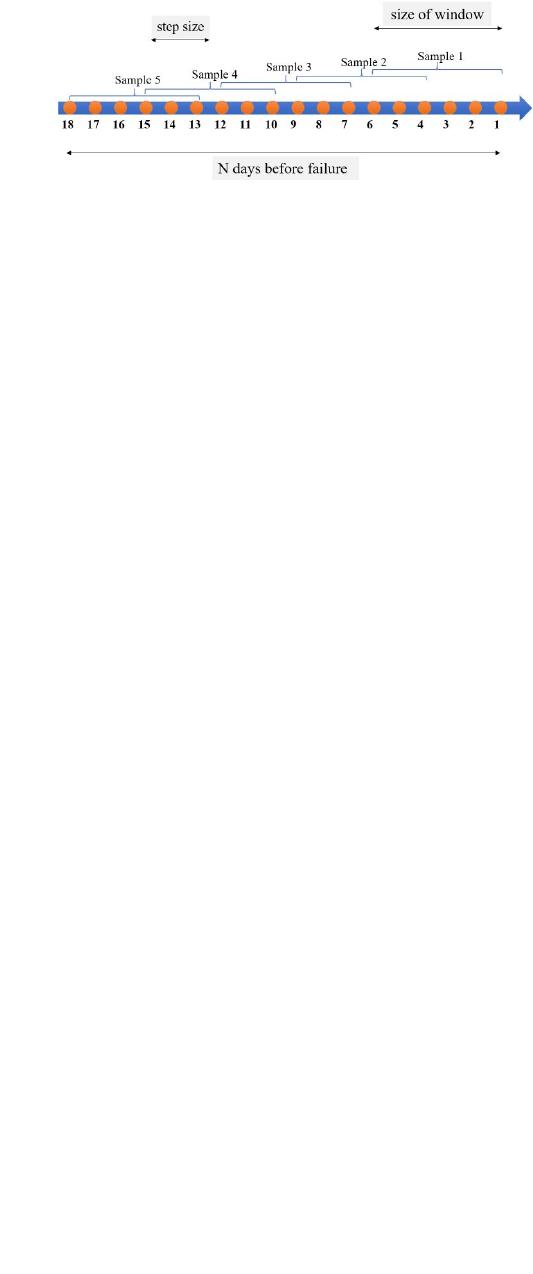
Fig. 1. The sliding window
As shown in Fig. 1, for the failure disk, the records within
N days before the failure time are used merely
, 18 or 30 are
common value of N. Each record item is sorted according to
the gathered time, and 3 or 6 days is set as the time window,
which is called the size of window. The starting position of
the time window is placed on the failure time of the disk, and
then the time window slides forward by a distance of step size,
maybe a half day. The time window is moved forward for
dozens of times
totally, until the time window covers all
records on the N days before failure. After sliding, the values
of average, variance and range in each time window are
calculated based on the record items, so that the information
of each record item at multiple consecutive time points is
combined into only one positive sample. Through the sliding
of the time sliding window, positive samples, which are tens
of times more than the original record will be created. For the
health disk, the original record of window size is selected
randomly
, and the values of average, variance and range are
also calculated for each record item as negative samples.
Three important parameters can be adjusted:
x The size of the window. The larger the window, the
more records a single sample contains. Of course, it is
not the more records, the better. Because the
difference of SMART within the window will be
more significant, at the same time, the difference
between samples will be smaller, and the number of
samples created will be less.
x The step size of window. If the step size is smaller
than the window, there will be overlap between two
adjacent windows, fortunately this will not lead
serious over fitting. If the step size is larger than the
window, some SMART data will lose, which is
unacceptable.
x N days before failure. This value needs observation to
determine. In fact, for different data centers, this value
varies greatly, which may be closely related to the IO
pressure of the data center. In the ZTE data center
studied in this paper, the SMART of the failure disk
is significantly different from that of more than 30
days before the failure, so the value is 30.
gg gy
14
Authorized licensed use limited to: ZTE CORPORATION. Downloaded on July 26,2023 at 12:22:01 UTC from IEEE Xplore. Restrictions apply.
B. Two-stage feature selection technology
As is known to all, not all the disk SMART features can
help to forecast whether a disk is about to fail. If inappropriate
features are selected for machine learning, it will not help the
forecast, maybe even have side effect. In addition, the more
features are used for machine learning, the longer time it takes,
which not only consumes a lot of CPU resources, but also
cannot forecast
in real time. Therefore, it is necessary to
perform feature selection, so that the most conducive to disk
failure forecast are used for modeling, and the time for model
training can be shorten as well. The simple way is selecting by
artificial experience or removal of the feature with a variance
of 0, but the effect is not good.
This paper proposes a two-stage feature selection
technology:
x After gathering SMART of all disks p times, the
features are characterized by N dimensions. Because
the SMART gathered by disks from different brands
or models has some differences, the feature selection
is for disks of the exactly same brand and model. If
the data center has different brands and models of
disks, it needs to select features separately.
x Calculate each variance of the features in p times, and
filter out the M features whose variance is less than
0.01. As a result, N-M features remain.
x Five algorithms are used to rank the importance of the
remaining N-M features, including Chi-
square test,
Logistic Regression, Support Vector Machine (SVM),
Random Forest, Gradient Boosted Iterative Decision
Tree (GBDT). A total of 5 sequences are formed,
which are labeled as sequences a1, a2, a3, a4,anda5.
x Calculate the average ranking value of each feature in
5 sequences, and then sort them to generate sequence
b. The N-M features are sorted according to their
average ranking values from small
to large.
x The Top-k features of sequence b are selected as the
final feature.
Take Seagate ST4000DM000 disk as an example. After
excluding features with variance less than 0.01, there are 21
SMART terms remaining. They will be numbered 1 to 21. The
importance of each feature is sorted according to the five
algorithms. As shown in Table 1, these results are synthesized
to form the final result. As shown in Fig.2, the model performs
best when the top 17 features are selected
.
TABLE I. AN EXAMPLE OF TWO-STAGE FEATURE SELECTION.
Stage
Sorted order
1
st
stage
Chi-square
test
21, 7, 19, 5, 10, 11, 9, 3, 6, 16, 17, 8, 13,
20, 14, 2, 4, 18, 12, 15, 1
Logistic
Regression
11, 9, 3, 20, 19, 17, 10, 16, 7, 8, 4, 5, 13,
6, 12, 18, 21, 2, 15, 14, 1
SVC
11, 9, 10, 17, 3, 16, 7, 20, 19, 8, 13, 4, 5,
12, 6, 2, 15, 21, 1, 14, 18
Random
Forest
16, 9, 14, 20, 5, 19, 21, 2, 6, 17, 11, 3,
15, 12, 4, 13, 1, 7, 18, 10, 8
GBDT
17, 16, 11, 9, 14, 20, 21, 5, 6, 19, 2, 4,
15, 3, 13, 8, 18, 7, 12, 1, 10
2
nd
stage
9, 11, 16, 17, 19, 20, 3, 5, 21, 7, 10, 6,
14, 4, 13, 2, 8, 12, 15, 18, 1
Fig. 2. The recall rate when selecting top-k features
After feature selection, a suitable machine learning
algorithm is needed to build a forecast model. This paper tried
XGBoost [7]. In recent years, it has been widely used in data
science competitions. In fact, after trying more than ten
different algorithms and more than a hundred different
parameter settings, we found that the algorithm has a small
impact on the accuracy of the disk failure forecast, and the
data quality has a large impact on the accuracy of the forecast.
However, it seems that in the issue of disk failure forecast,
data quality should be valued, which is always ignored by
researchers.
C.
Two-stage verification technology
The prior research works lacks verification of the forecast
results, and cannot be improved in a timely manner when
misjudgment occurs or the proactive reconstruction strategy is
inadequate. It has to wait for a long period of time to update
the forecast models from the newly gathered disk information.
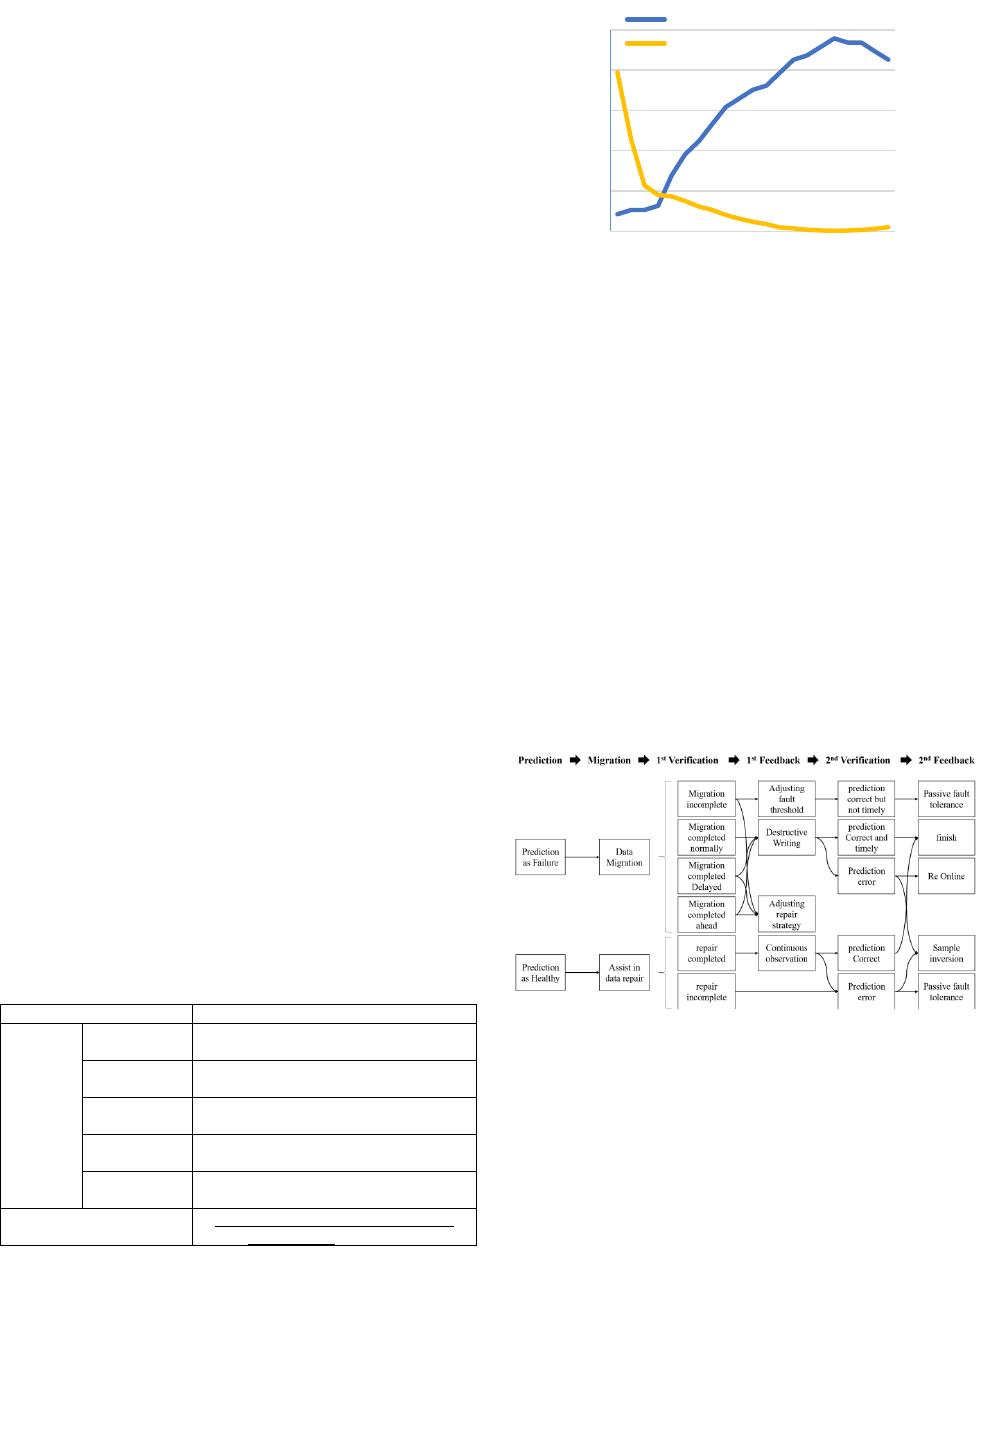
Therefore, in this section we propose a two-stage verification
technology of forecast results, which is shown in Fig. 3.
Fig. 3. Two-stage verification.
For disks that are forecasted to failure, proactive
reconstruction should be performed immediately:
x If a failure has occurred during the reconstruction
process, the system is downgraded, and the remaining
reconstruction work is completed by the other disks,
which are healthy, and the forecast threshold needs to
be adjusted. As a result, the disk should be
forecasted
as a failure disk sooner in the future.
8.51%
10.64%10.64%
12.77%
27.66%
38.30%
44.68%
53.19%
61.70%
65.96%
70.21%
72.34%
78.72%
85.11%
87.23%
91.49%
95.74%
93.62%
93.62%
89.36%
85.11%
39.44%
22.93%
11.45%
9.06%
8.69%
7.54%
6.18%
5.30%
4.06%
3.15%
2.39%
1.79%
1.00%
0.76%
0.42%
0.24%
0.21%
0.21%
0.33%
0.67%
1.06%
0.00%
10.00%
20.00%
30.00%
40.00%
50.00%
0.00%
20.00%
40.00%
60.00%
80.00%
100.00%
1 3 5 7 9 111315171921
Error rate(%)
recall rate(%)
Value of K
recall rate
error rate
gy
g
15
Authorized licensed use limited to: ZTE CORPORATION. Downloaded on July 26,2023 at 12:22:01 UTC from IEEE Xplore. Restrictions apply.
of 6
免费下载
【版权声明】本文为墨天轮用户原创内容,转载时必须标注文档的来源(墨天轮),文档链接,文档作者等基本信息,否则作者和墨天轮有权追究责任。如果您发现墨天轮中有涉嫌抄袭或者侵权的内容,欢迎发送邮件至:contact@modb.pro进行举报,并提供相关证据,一经查实,墨天轮将立刻删除相关内容。
最新上传
下载排行榜
1
2
9-数据库人的进阶之路:从PG分区、SQL优化到拥抱AI未来(罗敏).pptx
3
1-PG版本兼容性案例(彭冲).pptx
4
2-TDSQL PG在复杂查询场景中的挑战与实践-opensource.pdf
5
6-PostgreSQL 哈希索引原理浅析(文一).pdf
6
8-基于PG向量和RAG技术的开源知识库问答系统MaxKB.pptx
7
3-AI时代的变革者-面向机器的接口语言(MOQL)_吕海波.pptx
8
4-IvorySQL V4:双解析器架构下的兼容性创新实践.pptx
9
7-拉起PG好伙伴DifySupaOdoo.pdf
10
《云原生安全攻防启示录》李帅臻.pdf

相关文档
评论