


before you read this chapter, please get the basic understanding of Bethune X:
Changes in core data often trigger the butterfly effect of the business frontend, Database monitoring now becomes the primary requirement of enterprise. but how should we monitor?
The good monitoring tools reduce the time and resources needed for supporting databases and the underlying IT infrastructure, proactively troubleshoot performance problems before they reach end-users, and also improve capacity planning by determining whether issues can be resolved by upsizing database or server configurations.
However when a large number of alerts fill up your mailbox, when real-time visual data attracts all your attention, when you are urged by various reports due, you may realize that somehow the tools only makes you busier and busier.
Today I am going to tell you that O&M is not only about doing things right but doing the right things. the best and the only way to increase your work value is to always focus the priorities.
Your time matters, now try the alerts events management of Bethune X rescue you from the tedious and repetitive daily work.
get ready to be Efficient and Focused in you daily work
The event board displays the alert information of the selected time period, you can choose the last 3 hours, the last 6 hours, the last 24 hours, the last 3 days, the last 7 days as you wish.

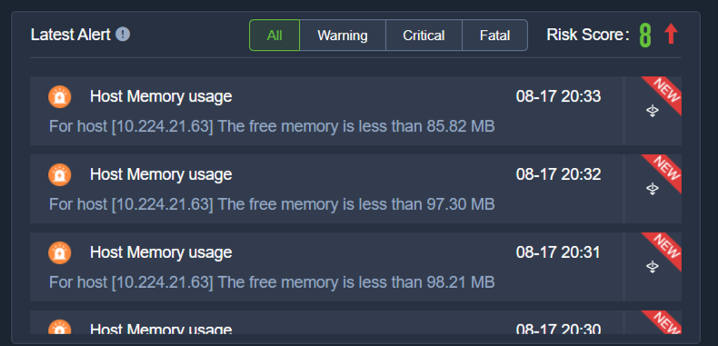
In the dashboard of the event module, you will find that the alerts events are catagoried by three dimensions, that is : category, level and status.
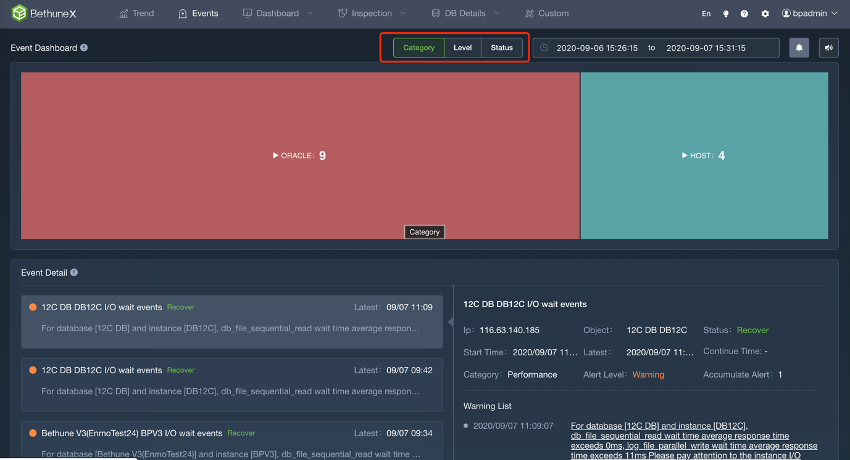
Category: The alert information are distinguished by the data source. Mainly divided into host and operating system alarms, Oracle database alarms, MySQL database alarms, PostgreSQL database alarms…
Level:the alert information are distinguished by the severity and urgency of the events, including three severity levels: warning, critical, and fatal. The higher the severity level, the more instant attention and processing are required.
Status: The alert information is divided according to the current status of the event. There are mainly the following statuses: in progress, expired, ignored, suspended and recovered.
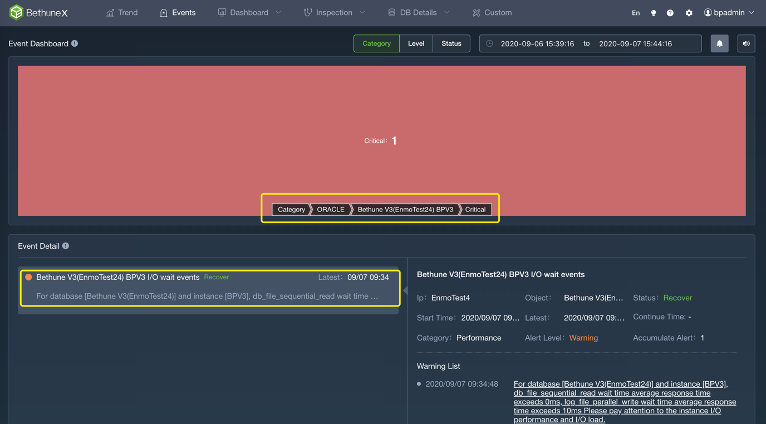
Each type of alert information can be tracked, and the corresponding replacement details will be listed under the alert overview.
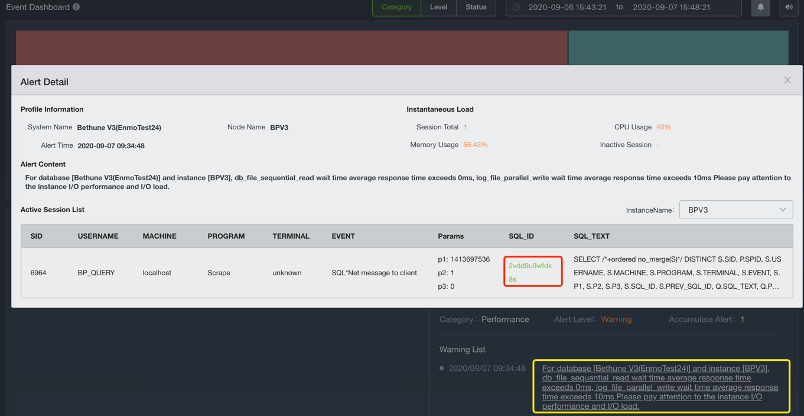
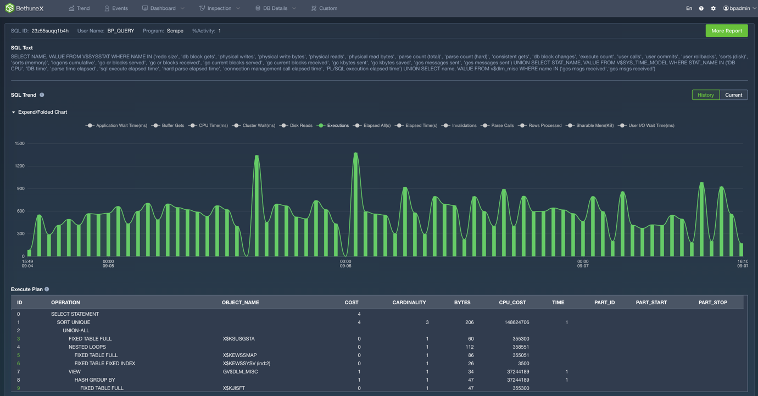
If the alert was triggered by inefficient SQL statement, then you can click the SQL ID for detailed statistics to help you positioning the root cause.
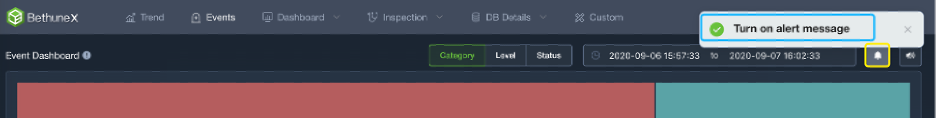
Of course if you are too busy, try the switch to display the pop-up alert events. Then you wouldn’t miss the remind from the Bethune X platform.
You may ask, what if I am not anywhere near computer? Don’t worry, the most important alerts which need your instant attention, Bethune X also send the email to remind you.
Open the alert strategy setting page:
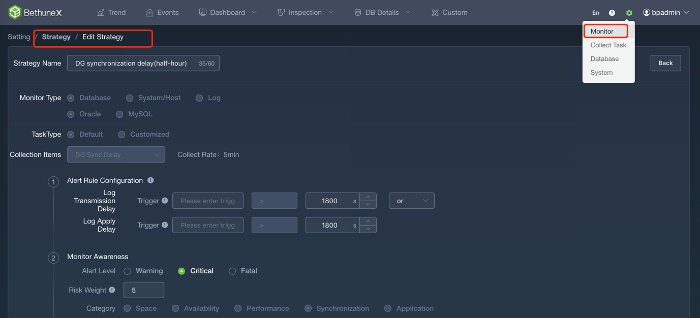
Then choose the alerts method you prefer:
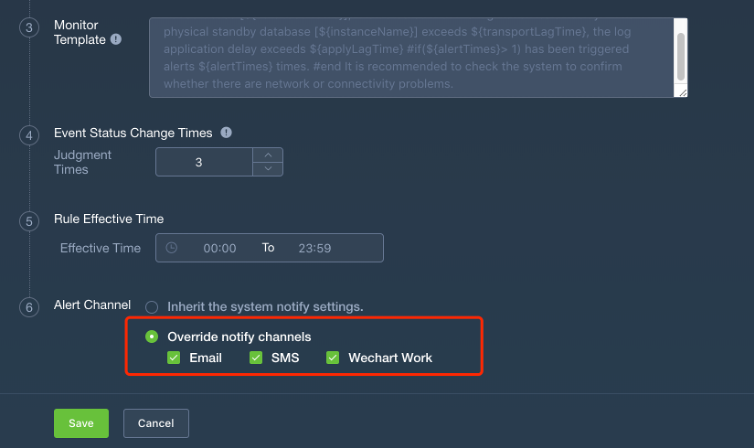
There, wherever you are, you wouldn’t miss the emergency call from Bethune X.
Bethune X has designed alert noise reduction, alarm aggregation and automatic switching of alarm event status. Through automatic switch of alert event status, Bethune X helps users filter out most of the information that does not need to be processed.
A example showing how to accomplish more with less time
Strategy: When a host CPU> 80%, the alarm information is triggered
Noise reduction: In the case of alert due to slight fluctuations, a trigger function can be configured to reduce noise, that is, to reduce frequent alarms.
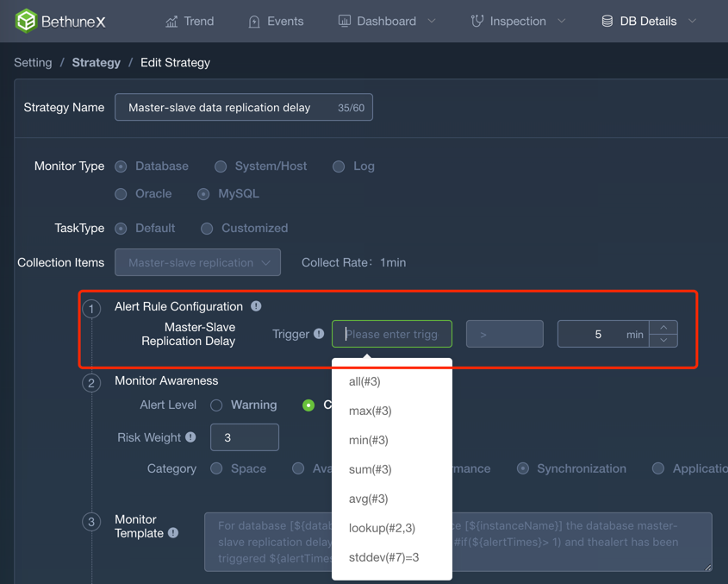
Trigger an alert: The event once again exceeds the threshold and continues to alerta, which is an “ongoing” alert event that requires DBA attention.
now you probably need to do something about it, and the traceability of Bethune X make it much easier for you :
Status switching: If the state change exceeds the threshold, the event will change from “ongoing” to “recovered” or “expired”, and the DBA does not need to pay attention to it. For example ifthe cumulative number of times is set 3, that is, when the event falls below the alarm threshold for three consecutive times, the status becomes “recovered”.
Simple and efficient, right?
Intelligent algorithms, intuitive data visualization and comprehensive analysis are the core features of Bethune X which help DBA detecte system risks quickly and concisely, the improved traceability tracking the root cause of the performance problem not only afterwards, but also to eliminate the bottleneck for peak hour performance beforehand.
Efficiency and focus, now let’s have both with Bethune X!


