


「目录」
绘图和可视化
Plotting and Visualization
9.1 => matplotlib
-------> figure and subplot
-------> 调整subplot周围的间距
-------> 标题、轴标签、刻度以及刻度标签
-------> 注解
-------> 图形
-------> 保存图片
-------> matplotlib配置
9.2 => pandas和seaborn绘图

注解
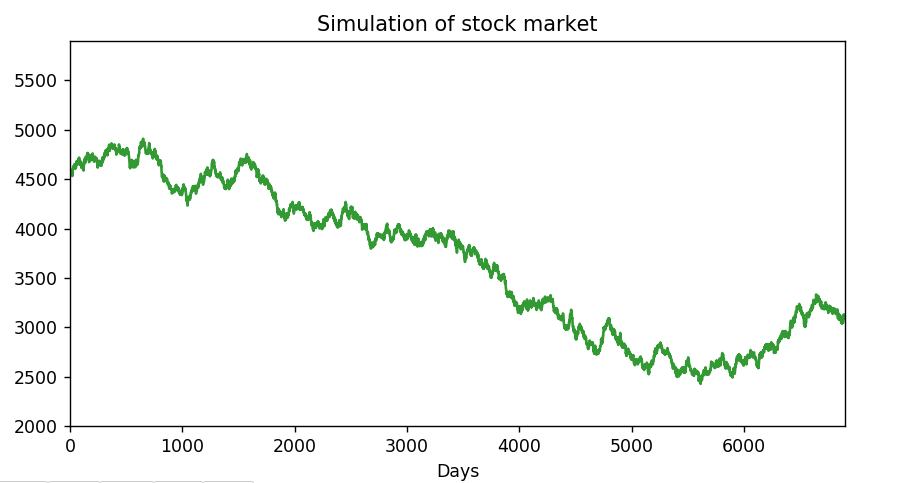
我们有时肯定希望在图像中绘制一些注解,可能是文本、箭头或图形。
先创建一个演示用的随机漫步形成的模拟股市走势图,X坐标的标签为Days,标题为'Simulation of stock market'。
我们可以使用set_xlim和set_ylim方法人为设置开始和结束的边界:
import matplotlib.pyplot as plt
import numpy as np
np.random.seed(10)
fig = plt.figure(figsize=(8,4))
ax = fig.add_subplot(1, 1, 1)
ax.plot(13*(np.random.randn(7000).cumsum()+350), 'g', alpha=0.8)
ax.set_xlabel('Days')
ax.set_title('Simulation of stock market')
ax.set_xlim([0, 6900])
ax.set_ylim([2000, 5900])复制
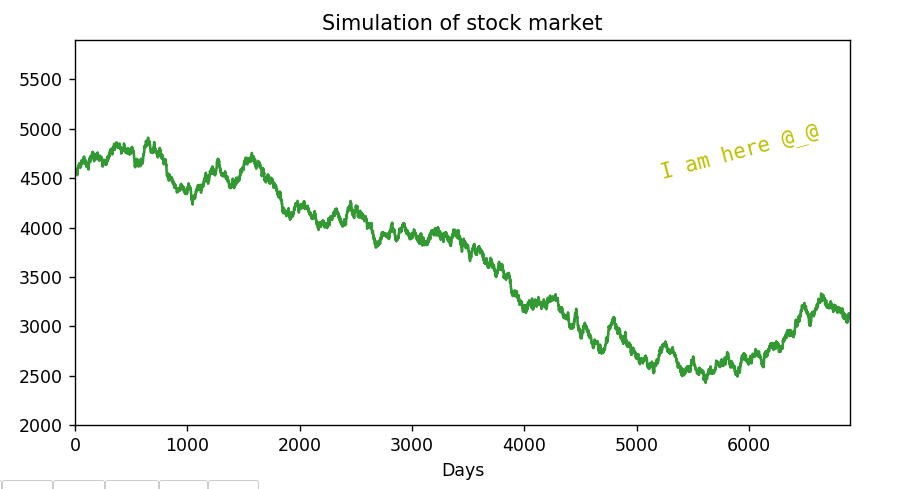
ax.text
ax.text可以将文本绘制在图表的指定坐标(x, y),family可以设置字体,fontsize设置字体大小,rotation设置旋转度数,更多可选参数可以查一下官方文档:
ax.text(5200, 4500, "I am here @_@", family='monospace', fontsize=12, color='y', rotation=15)复制
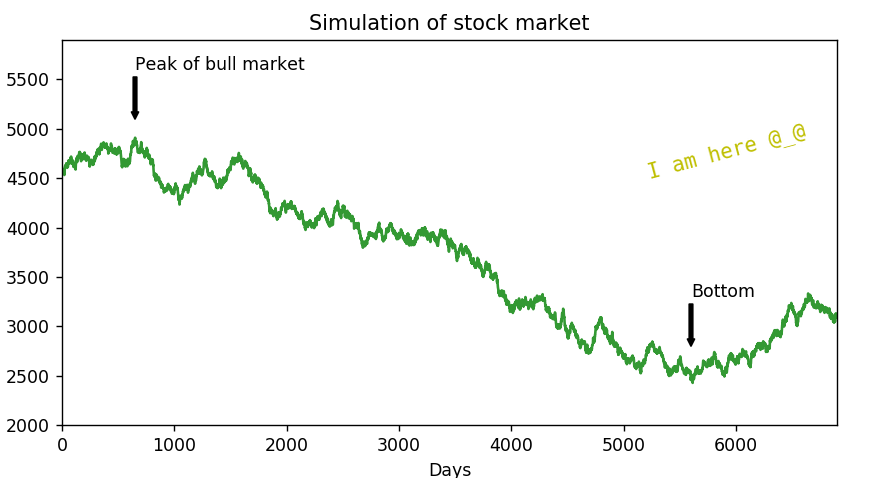
ax.annotate
我们也可以在注解中既包含文本也含有箭头,ax.annotate方法可以在指定的x和y坐标轴绘制标签。
annotate()中,xy为标注的位置,xytext为文本的位置,arrowprops可以控制箭头的属性。
比如下面我们用箭头和文本指出牛市顶部和熊市底部的位置:
ax.annotate('Peak of bull market', xy=(650, 5100), xytext=(650, 5600), arrowprops=dict(facecolor='black', headwidth=4, width=2, headlength=4))
ax.annotate('Bottom', xy=(5600, 2800), xytext=(5600, 3300), arrowprops=dict(facecolor='black', headwidth=4, width=2, headlength=4))复制
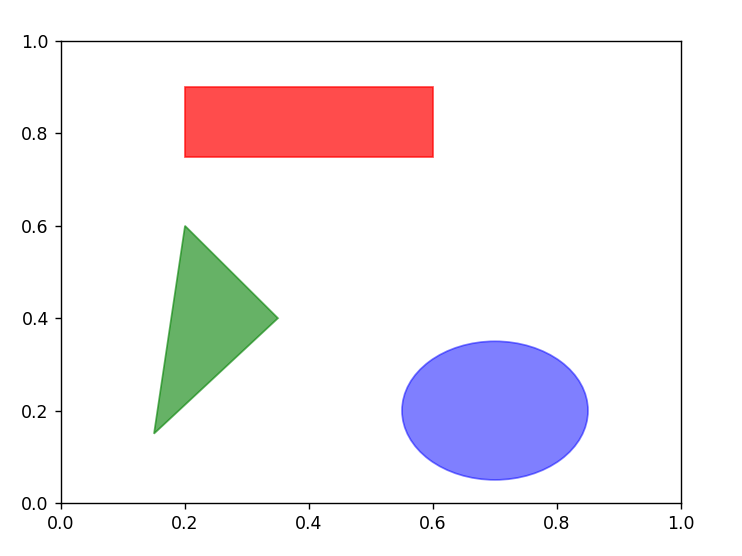
绘制图形
绘制图形需要先创建块对象,然后通过add_patch()添加到subplot中:
fig = plt.figure()
ax = fig.add_subplot(1, 1, 1)
rect = plt.Rectangle((0.2, 0.75), 0.4, 0.15, color='r', alpha=0.7)
circ = plt.Circle((0.7, 0.2), 0.15, color='b', alpha=0.5)
pgon = plt.Polygon(([0.15, 0.15], [0.35, 0.4], [0.2, 0.6]), color='g', alpha=0.6)
ax.add_patch(rect)
ax.add_patch(circ)
ax.add_patch(pgon)复制
保存图像
保存图像很简单,其中dpi可以设置分辨率,bbox_inches如果设置为'tight',则会剪除图表周围的空白部分:
plt.savefig(‘fig.png’, dpi=400, bbox_inches='tight')复制
matplotlib配置
matplotlib自带一些配色方案,以及为生成出版质量的图片而设定的默认配置信息。
我们也可以通过使用rc方法全局参数自定义,用于管理图像大小、subplot边距、配色方案、字体大小、网格类型等。
plt.rc('figure', figsize=(10, 10))复制
rc的第一个参数是希望自定义的对象,包括'figure'、'axes'、'xtick'、'ytick'、'grid'、'legend'。
font = {'family' : 'monospace',
'weight' : 'bold'}
plt.rc('font', **font)复制
就这样吧,BYE-BYE
往期回顾


Stay hungry, stay foolish
