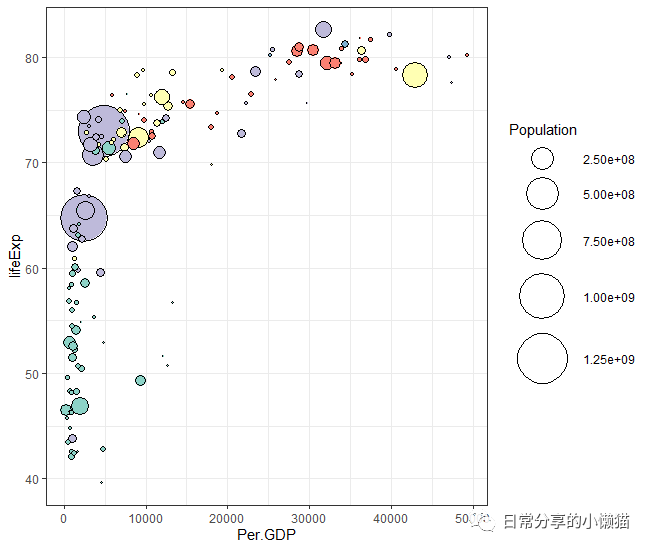
气泡图属于散点图的一种形式,当需要反映多个连续变量时,使用气泡图具有较好的效果。本文以R语言中的ggplot2为例展示气泡图(Bubble plot)[1]的绘制过程。效果如下图所示: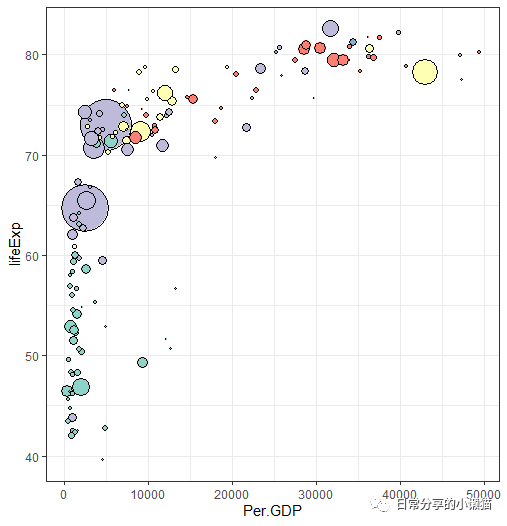
1、数据准备
以gapminder包中关于全球一百多个国家或地区的预期寿命(lifeExp)、人口数量(pop)、人均GDP(gdpPercap)的面板数据为例。
#install.packages("RColorBrewer")
#install.packages("gapminder")
#install.packages("ggplot2")
library(RColorBrewer)
library(gapminder)
library(ggplot2)
mydata <- subset(gapminder, year == "2007") #以2007年数据为例
head(mydata)
# A tibble: 6 x 6
# country continent year lifeExp pop gdpPercap
# <fct> <fct> <int> <dbl> <int> <dbl>
#1 Afghanistan Asia 2007 43.8 31889923 975.
#2 Albania Europe 2007 76.4 3600523 5937.
#3 Algeria Africa 2007 72.3 33333216 6223.
#4 Angola Africa 2007 42.7 12420476 4797.
#5 Argentina Americas 2007 75.3 40301927 12779.
#6 Australia Oceania 2007 81.2 20434176 34435.
str(mydata)
#tibble [142 x 6] (S3: tbl_df/tbl/data.frame)
# $ country : Factor w/ 142 levels "Afghanistan",..: 1 2 3 4 5 6 7 8 9 10 ...
# $ continent: Factor w/ 5 levels "Africa","Americas",..: 3 4 1 1 2 5 4 3 3 4 ...
# $ year : int [1:142] 2007 2007 2007 2007 2007 2007 2007 2007 2007 2007 ...
# $ lifeExp : num [1:142] 43.8 76.4 72.3 42.7 75.3 ...
# $ pop : int [1:142] 31889923 3600523 33333216 12420476 40301927 20434176 8199783 708573 150448339 10392226 ...
# $ gdpPercap: num [1:142] 975 5937 6223 4797 12779 ...复制
2、图形绘制
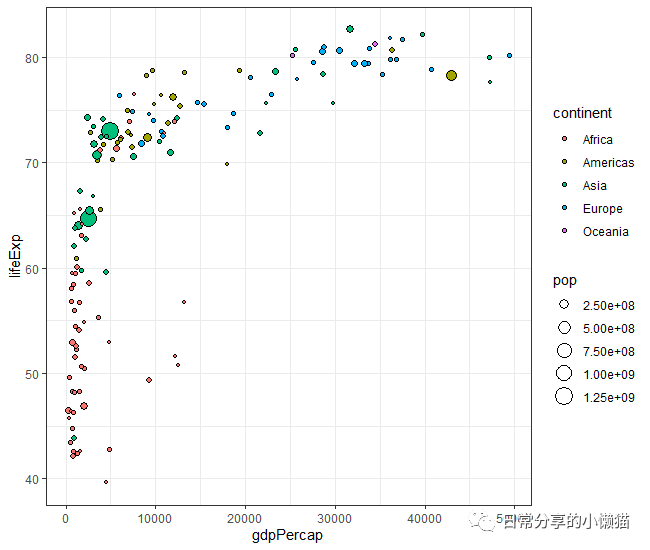
2.1 基础图形绘制。将gdpPercap作为x轴变量,lifeExp作为y轴变量,pop映射到size,continent映射到fill,分别做为大小填充和颜色填充。
ggplot(mydata, aes(x=gdpPercap, y=lifeExp, size = pop, fill = continent)) +
geom_point(shape = 21, color = "black") +
theme_bw()复制
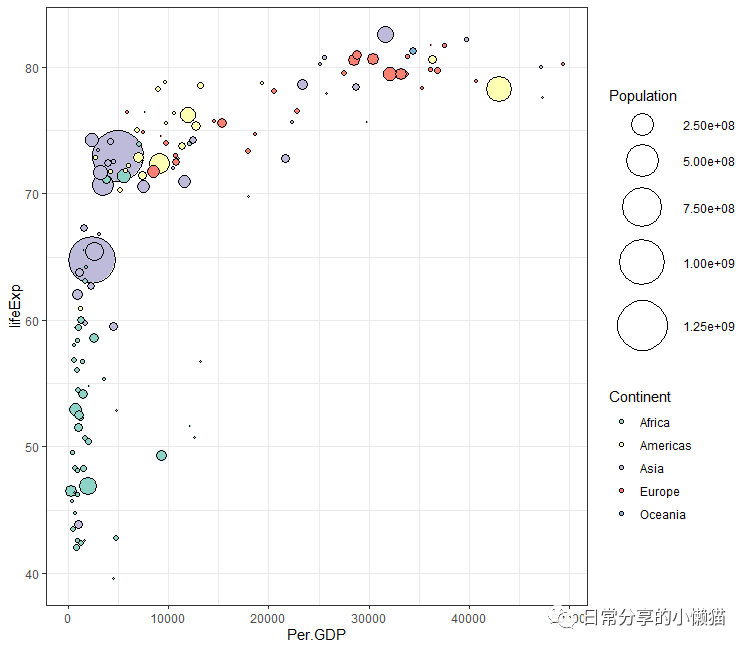
2.2 调整size和fill的映射大小及颜色。
ggplot(mydata, aes(x=gdpPercap, y=lifeExp, size = pop, fill = continent)) +
geom_point(shape = 21, color = "black") +
scale_size(range = c(.1, 18)) + #调整size大小
scale_fill_brewer(palette = "Set3") +
theme_bw()+
labs(x ="Per.GDP", y = "lifeExp", size = "Population", fill = "Continent")复制
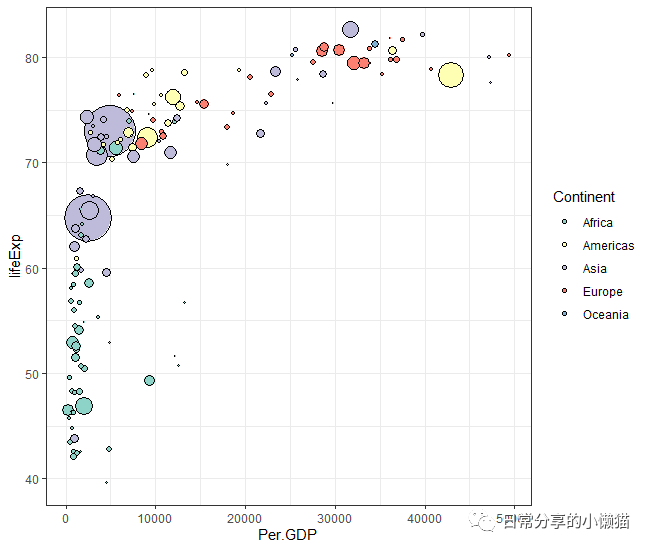
2.3 移除size图例或fill图例。通过在scale_size() 函数或scale_fill_brewer() 内添加guide = "none" 参数,达到移除一个或者两个图例的目的。
#移除size图例
ggplot(mydata, aes(x=gdpPercap, y=lifeExp, size = pop, fill = continent)) +
geom_point(shape = 21, color = "black") +
scale_size(range = c(.1, 18), guide = "none") +
scale_fill_brewer(palette = "Set3") +
theme_bw()+
labs(x ="Per.GDP", y = "lifeExp", size = "Population", fill = "Continent")复制
#移除fill图例
ggplot(mydata, aes(x=gdpPercap, y=lifeExp, size = pop, fill = continent)) +
geom_point(shape = 21, color = "black") +
scale_size(range = c(.1, 18)) +
scale_fill_brewer(palette = "Set3", guide = "none") +
theme_bw()+
labs(x ="Per.GDP", y = "lifeExp", size = "Population", fill = "Continent")复制
2.4 移除所有图例。添加theme(legend.position = "none") 图层。
ggplot(mydata, aes(x=gdpPercap, y=lifeExp, size = pop, fill = continent, color = continent)) +
geom_point(shape = 21, color = "black") +
#scale_size_area() +
scale_size(range = c(.1, 18)) +
#ggrepel::geom_text_repel(aes(label = country, color = continent), show.legend = FALSE, color = "black") +
#ggrepel::geom_text_repel(aes(label = country),color = "black",max.overlaps = 30) + #添加标签
scale_fill_brewer(palette = "Set3") +
theme_bw()+
labs(x ="Per.GDP", y = "lifeExp", size = "Population", fill = "Continent") +
theme(legend.position = "none")复制
3、其他
更多绘图方法可查看公众号其他推文。此外,关于ggplot2绘制散点图可进一步阅读R语言绘图|散点图与回归拟合曲线。
如有帮助请多多点赞哦!
参考资料
Bubble plot with ggplot2: https://r-graph-gallery.com/320-the-basis-of-bubble-plot.html
文章转载自日常分享的小懒猫,如果涉嫌侵权,请发送邮件至:contact@modb.pro进行举报,并提供相关证据,一经查实,墨天轮将立刻删除相关内容。


