散点图通常用来刻画两个连续变量之间的关系,是论文中一种常见图形,同时在散点图的绘制过程中,通常会加入变量间的拟合曲线来进一步对变量间的关系进行预测。本文以两个变量间的基础散点图为例,展示散点图及添加回归拟合曲线的基本过程,同时对分组、分面以及连续变量等不同类型的散点图进行扩展,以丰富散点图的表达形式,主要内容参考Winston Chang所著的《R数据可视化手册》(第二版)[1]。
加载package与数据准备
以gcookbook包中的heightweight数据集为例绘制散点图与散点图拟合曲线,该数据集为一组学生的性别、身高、体重等方面的数据。在绘图前,应安装与加载gcookbook、ggplot2、ggthemes三个相关的package。
#install.packages("gcookbook")
#install.packages("ggplot2")
#install.packages("ggthemes")
library(gcookbook)
library(ggplot2)
library(ggthemes)
head(heightweight) #学生身高体重数据集
# sex ageYear ageMonth heightIn weightLb
#1 f 11.92 143 56.3 85.0
#2 f 12.92 155 62.3 105.0
#3 f 12.75 153 63.3 108.0
#4 f 13.42 161 59.0 92.0
#5 f 15.92 191 62.5 112.5
#6 f 14.25 171 62.5 112.0
str(heightweight)
#'data.frame': 236 obs. of 5 variables:
# $ sex : Factor w/ 2 levels "f","m": 1 1 1 1 1 1 1 1 1 1 ...
# $ ageYear : num 11.9 12.9 12.8 13.4 15.9 ...
# $ ageMonth: int 143 155 153 161 191 171 185 142 160 140 ...
# $ heightIn: num 56.3 62.3 63.3 59 62.5 62.5 59 56.5 62 53.8 ...
# $ weightLb: num 85 105 108 92 112 ...复制
1、基础散点图
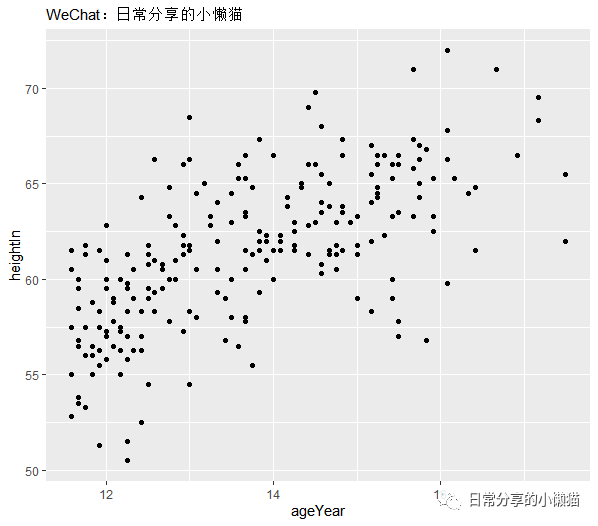
使用heightweight数据集中的ageYear与heightIn变量绘制散点图。
1.1 基础图形
ggplot(heightweight, aes(x = ageYear, y = heightIn)) +
geom_point()复制
1.2 添加回归拟合曲线
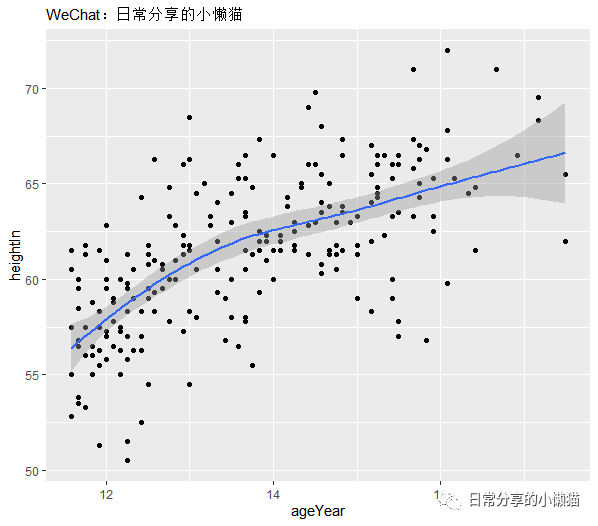
默认的回归拟合曲线方程为loess(局部加权回归)。如果需要修改为线性回归方程,可以在geom_smooth() 中添加method = lm来对回归拟合曲线的方程进行修改。
ggplot(heightweight, aes(x = ageYear, y = heightIn)) +
geom_point() +
geom_smooth()复制
1.3 进一步修饰
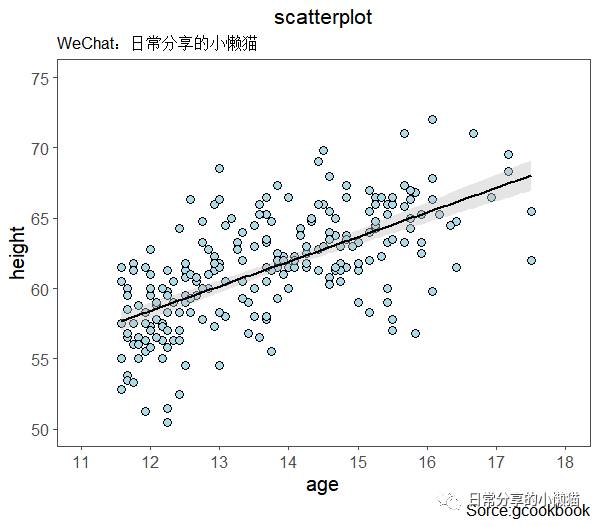
对散点图中点的大小、颜色、形状、回归拟合曲线、x轴与y轴的刻度、标签及轴标题、图标题、主题等进一步修饰。
ggplot(heightweight, aes(x = ageYear, y = heightIn)) + #映射
geom_point(shape = 21, color = "black", fill = "lightblue", size = 3) + #调整散点图
geom_smooth(method = lm, se = TRUE, color = "black", fill = "grey") + #添加回归曲线
scale_y_continuous(limits = c(50,75), breaks = seq(50,75,5)) + #调整y轴标签范围及刻度
scale_x_continuous(limits = c(11,18), breaks = seq(11,18,1)) +#调整x轴标签范围及刻度
labs(x = "age", y = "height", title = "scatterplot", caption = "Sorce:gcookbook") + #轴标题及图标题设置
theme_few() + #主题
theme(plot.title = element_text(hjust = 0.5, size = 16), #调整图标题文本
plot.caption = element_text(size = 12), #调整caption文本
axis.text = element_text(size = 12), #调整轴标签文本
axis.title = element_text(size = 15)) #调整轴标题文本复制
2、分组散点图
2.1 基础图形
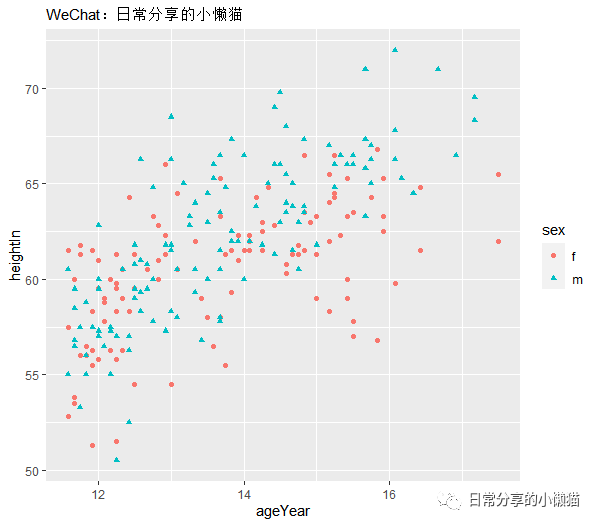
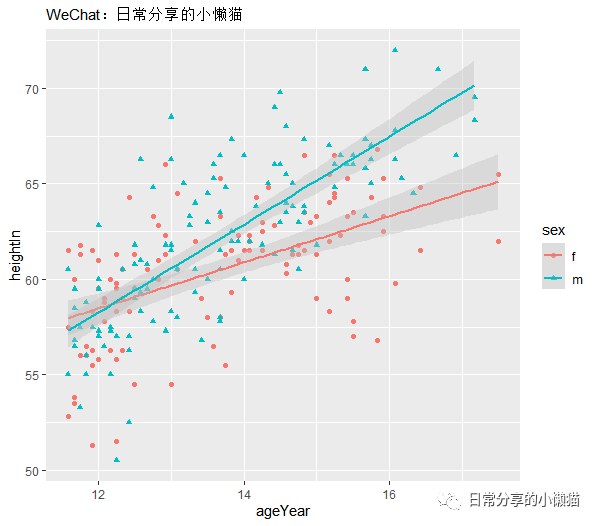
以sex为分组变量,使用color与shape对其进行映射,以此绘制分组散点图。
ggplot(heightweight, aes(x = ageYear, y = heightIn, color = sex, shape = sex)) +
geom_point()复制
2.2 添加回归拟合曲线
使用线性回归 (lm) 方法添加回归拟合曲线。
ggplot(heightweight, aes(x = ageYear, y = heightIn, color = sex, shape = sex)) +
geom_point() +
geom_smooth(method = lm)复制
2.3 进一步修饰
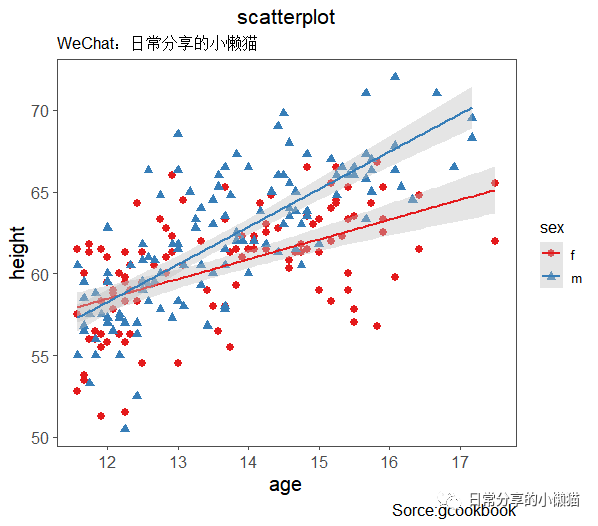
对散点图的颜色、大小进行调整,对回归拟合曲线的颜色、置信域进行调整,对轴标题、图标题及绘图主题等进行调整。
ggplot(heightweight, aes(x = ageYear, y = heightIn, color = sex, shape = sex)) +
geom_point(size = 2.5) +
geom_smooth(method = lm, se = TRUE, fill = "grey") +
scale_color_brewer(palette = "Set1") +
scale_x_continuous(breaks = seq(12,18,1)) +
labs(x = "age", y = "height", title = "scatterplot", caption = "Sorce:gcookbook") +
theme_few() +
theme(plot.title = element_text(hjust = 0.5, size = 16),
plot.caption = element_text(size = 12),
axis.text = element_text(size = 12),
axis.title = element_text(size = 15))复制
3、分面散点图
3.1 基础图形
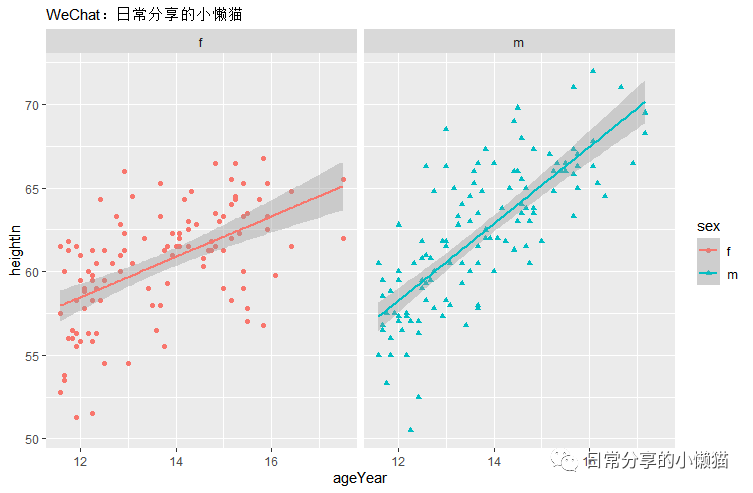
以sex变量为分面依据,使用facet_grid() 图层函数来绘制分面散点图。
ggplot(heightweight, aes(x = ageYear, y = heightIn, color = sex, shape = sex)) +
geom_point() +
geom_smooth(method = lm) +
facet_grid(~ sex) #分面:横向排列复制
3.2 进一步修饰
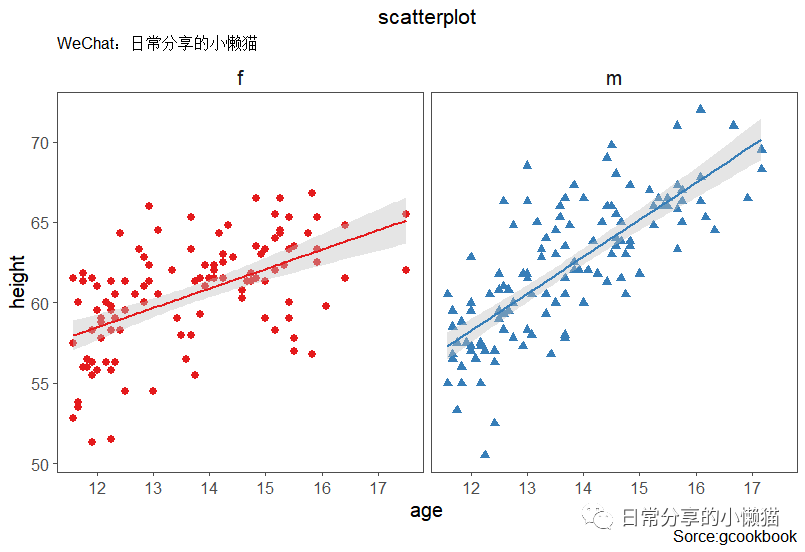
与分组变量散点图修饰过程类似,注意对分面标签大小的调整参数为strip.text = element_text() ,通过控制size大小来调整标签。
ggplot(heightweight, aes(x = ageYear, y = heightIn, color = sex, shape = sex)) +
geom_point(size = 2.5) +
geom_smooth(method = lm, se = TRUE, fill = "grey") +
scale_color_brewer(palette = "Set1") +
scale_x_continuous(breaks = seq(12,18,1)) +
labs(x = "age", y = "height", title = "scatterplot", caption = "Sorce:gcookbook") +
theme_few() +
facet_grid(~ sex) + #分面:横向排列
#facet_grid(sex~.) + #分面:纵向排列
theme(legend.position = "none") + #移除图例
theme(strip.text = element_text(size = 16)) +
theme(plot.title = element_text(hjust = 0.5, size = 16),
plot.caption = element_text(size = 12),
axis.text = element_text(size = 12),
axis.title = element_text(size = 15))复制
4、将连续变量映射到散点图中(使用color映射)
4.1 基础图形
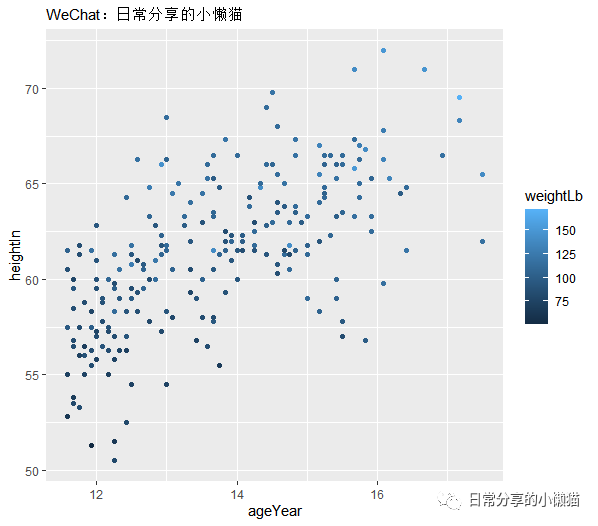
将连续变量weightLb作为color映射到散点图中,以颜色的深浅来反映第三个连续变量。
ggplot(heightweight, aes(x = ageYear, y = heightIn, color = weightLb)) +
geom_point()复制
4.2 进一步修饰
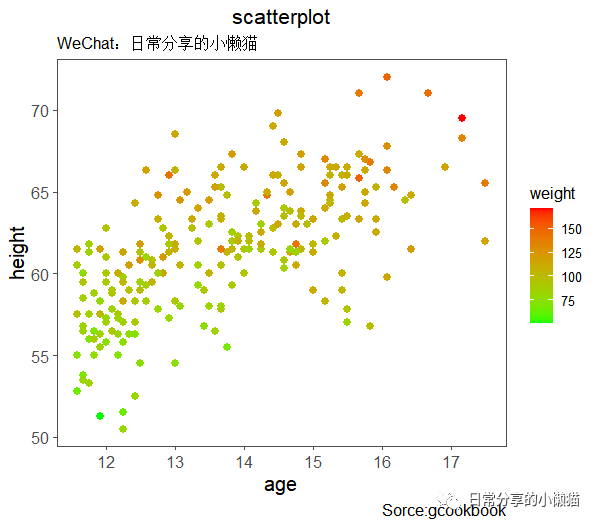
通过使用scale_color_gradient() 图层参数,指定颜色的低值 (low) 与高值 (high) 来控制颜色的变化。
ggplot(heightweight, aes(x = ageYear, y = heightIn, color = weightLb)) +
geom_point(size = 2.5) +
scale_color_gradient(low = "green", high = "red") +
scale_x_continuous(breaks = seq(12,18,1)) +
labs(x = "age", y = "height", title = "scatterplot", caption = "Sorce:gcookbook", color = "weight") +
theme_few() +
theme(plot.title = element_text(hjust = 0.5, size = 16),
plot.caption = element_text(size = 12),
axis.text = element_text(size = 12),
axis.title = element_text(size = 15))复制
5、将连续变量映射到散点图中(使用size映射)
5.1 基础图形
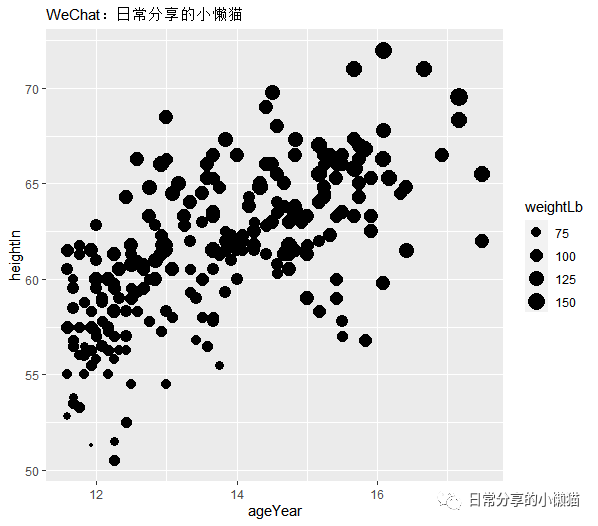
将连续变量weightLb作为size映射到散点图中,以点的大小来反映第三个连续变量。
ggplot(heightweight, aes(x = ageYear, y = heightIn, size = weightLb)) +
geom_point()复制
5.2 进一步修饰
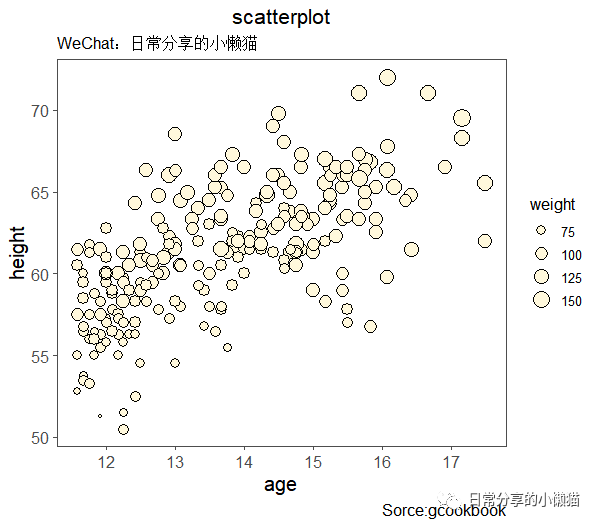
对点的颜色、形状、轴标题、图标题、主题等进行调整。此外,也可以通过添加scale_size_area() 图层函数来使得点的面积与变量值成正比。
ggplot(heightweight, aes(x = ageYear, y = heightIn, size = weightLb)) +
geom_point(shape = 21, fill = "cornsilk", color = "black") +
scale_x_continuous(breaks = seq(12,18,1)) +
labs(x = "age", y = "height", title = "scatterplot", caption = "Sorce:gcookbook", size = "weight") +
theme_few() +
#scale_size_area() + #点的面积与变量值成正比
theme(plot.title = element_text(hjust = 0.5, size = 16),
plot.caption = element_text(size = 12),
axis.text = element_text(size = 12),
axis.title = element_text(size = 15))复制
6、将类别变量与连续变量映射到散点图中
6.1 基础图形
将sex作为类别变量映射到color中,将weightLb作为连续变量映射到size中。
ggplot(heightweight, aes(x = ageYear, y = heightIn, color = sex, size = weightLb)) +
geom_point()复制

6.2 进一步修饰
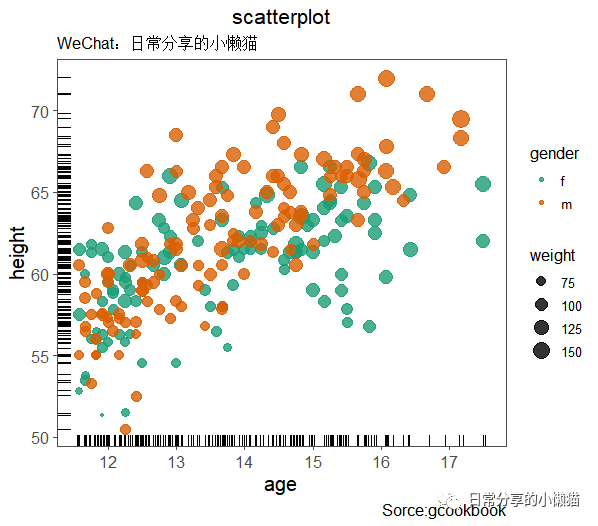
对点的颜色、绘图主题、坐标轴等进一步修饰。此外,也可以通过添加geom_rug() 图层函数来向散点图中添加地毯图。
ggplot(heightweight, aes(x = ageYear, y = heightIn, color = sex,size = weightLb)) +
geom_point(alpha = 0.8) +
geom_rug(position = "jitter", size = 0.1, color = "black") + #添加地毯图
scale_x_continuous(breaks = seq(12,18,1)) +
labs(x = "age", y = "height", title = "scatterplot", caption = "Sorce:gcookbook", color = "gender", size = "weight") +
theme_few() +
scale_color_brewer(palette = "Dark2") +
theme(plot.title = element_text(hjust = 0.5, size = 16),
plot.caption = element_text(size = 12),
axis.text = element_text(size = 12),
axis.title = element_text(size = 15))复制
其他
关于散点图与回归拟合曲线内容可进一步参考Winston Chang所著的R Graphics Cookbook。此外,有时还涉及根据已有模型向散点图中添加回归拟合曲线,在后续更新中也会涉及相关方面内容。
如有帮助请多多点赞哦!
参考资料
Winston Chang著,王佳,林枫等,译: R数据可视化手册(第二版)[M].人民邮电出版社,2021


