


很多监控工具都使用agent在目标机上进行数据采集,然后push到监控服务器server上进行入库,然后通过入库前或者入库后通过规则发送告警。prometheus当然也有agent,但他的名字很形象,叫exporter。和服务端的retrival对应,可以更好的理解。
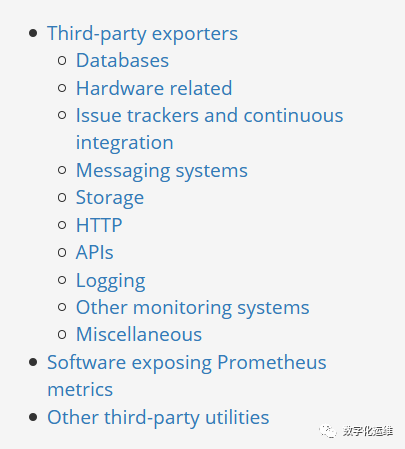
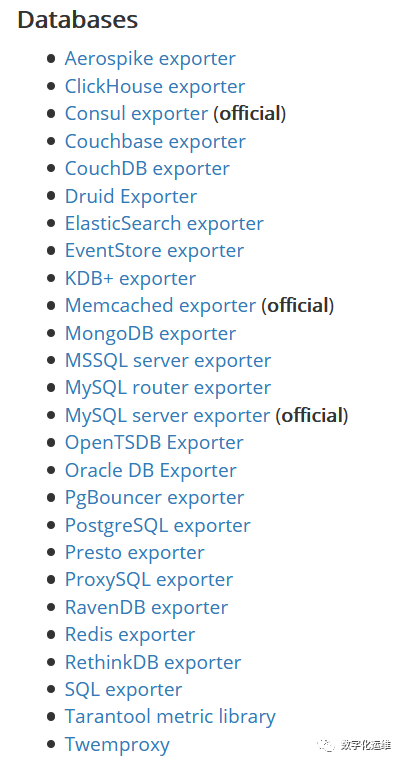
prometheus官方给出了一些official exporter,也有一些在github上被star很多的exporter被官方收录的,我们可以在prometheus文档的INSTRUMENTING章节的Exporters and integrations找出所有official和第三方的exporter,这里只贴出分类和databases项作为举例,整体还是非常全面的。
以oracledb_exporter进行举例
github开源项目 >>>> https://github.com/iamseth/oracledb_exporter
exporter下载地址:
https://github.com/iamseth/oracledb_exporter/releases目前版本为0.2.9,由文件名可以看出是基于oracle 18.5这个版本进行编译的。经过验证,19c也是没问题的。
oracledb_exporter.0.2.9-ora18.5.linux-amd64.tar.gz
在要监控的目标oracle数据库服务器上解压、安装、修改权限
tar -zxf oracledb_exporter*
cd oracledb_exporter*
cp oracledb_exporter /usr/local/bin/
chmod 755 usr/local/bin复制
*我们约定,所有的exporter都安装在/usr/local/bin/目录下
将oracledb_exporter作为系统服务,这与prometheus服务是类似的。
vi /etc/systemd/system/multi-user.target.wants/oracledb_exporter.service
[Unit]
Description=oracledb_exporter
Documentation=https://github.com/iamseth/oracledb_exporter
Wants=network-online.target
After=network-online.target
[Service]
Type=simple
User=oracle
Group=oinstall
Environment="ORACLE_HOME=/oracle/app/oracle/product/19c/dbhome_1"
Environment="DATA_SOURCE_NAME=user/password@//myhost:1521/service"
Environment="LD_LIBRARY_PATH=/oracle/app/oracle/product/19c/dbhome_1/lib"
ExecStart=/usr/local/bin/oracledb_exporter -log.level error -default.metrics /oracle/soft/cust-metrics.toml
[Install]
WantedBy=multi-user.target复制
这里需要注意几点内容:
1)属组是oracle:oinstall
2)environment设置要包含:
ORACLE_HOME:指引oracle客户端位置
DATA_SOURCE_NAME:数据库连接串,支持sid和service两种方式
LD_LIBRARY_PATH:不设置是不识别library的,会报错,github作者也明确说了这一点
error while loading shared libraries: libclntsh.so.xx.x: cannot open shared object file: No such file or directory复制
3)execstart中注意要有-default.metrics项,文件的内容包含自定义数据库查询功能,这一点是这个exporter的两点,想取什么数据,只要按照格式,用SQL查询出即可,非常方便。
添加服务,启动服务
#systemctl enable oracledb_exporter
#systemctl start oracledb_exporter复制
*RHEL6的环境,可以对应参考prometheus在rhel 6的启动方式。
在rhel7的rsyslog中查看是否有报错。确认程序正常启动。
oracledb_exporter_last_scrape_duration_seconds
oracledb_exporter_last_scrape_error
oracledb_exporter_scrapes_total
oracledb_up
oracledb_activity_execute_count
oracledb_activity_parse_count_total
oracledb_activity_user_commits
oracledb_activity_user_rollbacks
oracledb_sessions_activity
oracledb_wait_time_application
oracledb_wait_time_commit
oracledb_wait_time_concurrency
oracledb_wait_time_configuration
oracledb_wait_time_network
oracledb_wait_time_other
oracledb_wait_time_scheduler
oracledb_wait_time_system_io
oracledb_wait_time_user_io
oracledb_tablespace_bytes
oracledb_tablespace_max_bytes
oracledb_tablespace_bytes_free
oracledb_process_count
oracledb_resource_current_utilization
oracledb_resource_limit_value复制
oracledb_exporter help
# /usr/local/bin/oracledb_exporter -h
Usage of /usr/local/bin/oracledb_exporter:
-custom.metrics string
File that may contain various custom metrics in a TOML file. (env: CUSTOM_METRICS)
-database.maxIdleConns int
Number of maximum idle connections in the connection pool. (env: DATABASE_MAXIDLECONNS)
-database.maxOpenConns int
Number of maximum open connections in the connection pool. (env: DATABASE_MAXOPENCONNS) (default 10)
-default.metrics string
File with default metrics in a TOML file. (env: DEFAULT_METRICS) (default "default-metrics.toml")
-log.format value
If set use a syslog logger or JSON logging. Example: logger:syslog?appname=bob&local=7 or logger:stdout?json=true. Defaults to stderr.
-log.level value
Only log messages with the given severity or above. Valid levels: [debug, info, warn, error, fatal].
-query.timeout string
Query timeout (in seconds). (env: QUERY_TIMEOUT) (default "5")
-web.listen-address string
Address to listen on for web interface and telemetry. (env: LISTEN_ADDRESS) (default ":9161")
-web.telemetry-path string
Path under which to expose metrics. (env: TELEMETRY_PATH) (default "/metrics")复制
在prometheus服务器的配置文件prometheus.yml中添加以下内容
- job_name: oracle
static_configs:
- targets: ['your ip:9161']
labels:
instance: pre-product_oracle_<your IP>复制
这里需要注意一点,oracledb_exporter端口号默认是9161,当然也可以更改,可以看
重启prometheus
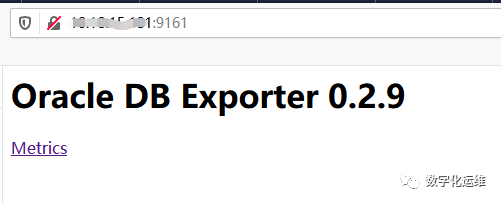
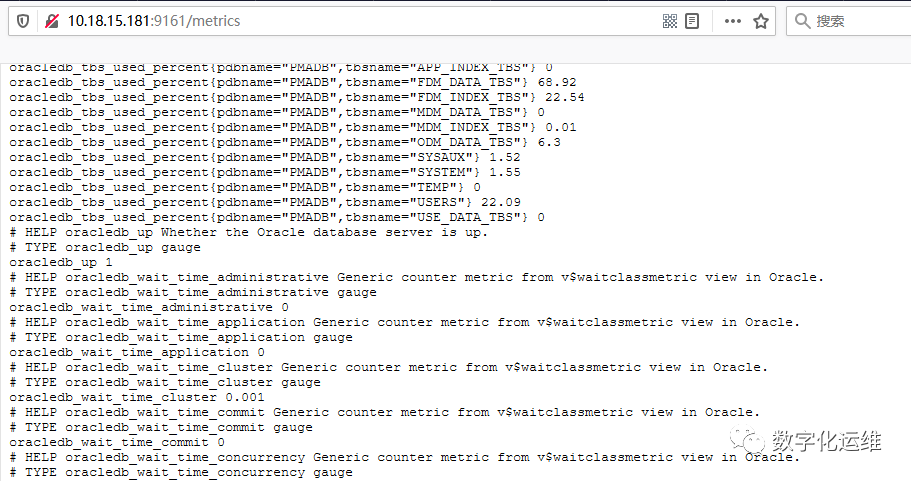
来浏览器访问看看oracle数据库的9161端口
通过prometheus服务端看看是否已经能够获取被监控数据库的信息了?
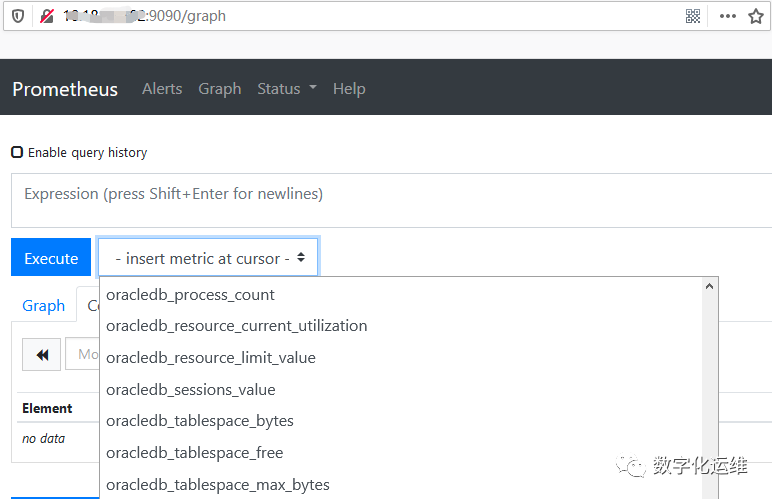
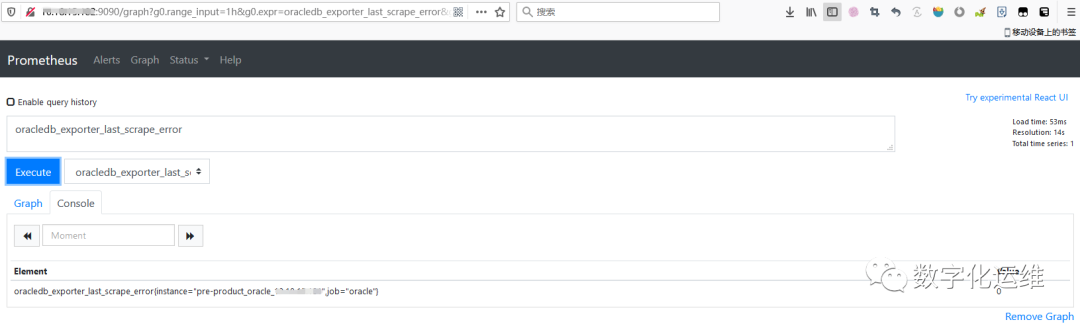
已经成功使用了!

附上一幅结合grafana的图,看看效果如何。grafana的炫酷效果体验非常棒!

