


本文主要介绍在R语言中如何利用ggplot2绘制点图(dotplot),点图可用于展示数据的分布状态,每个点代表一个观测值。如下图所示: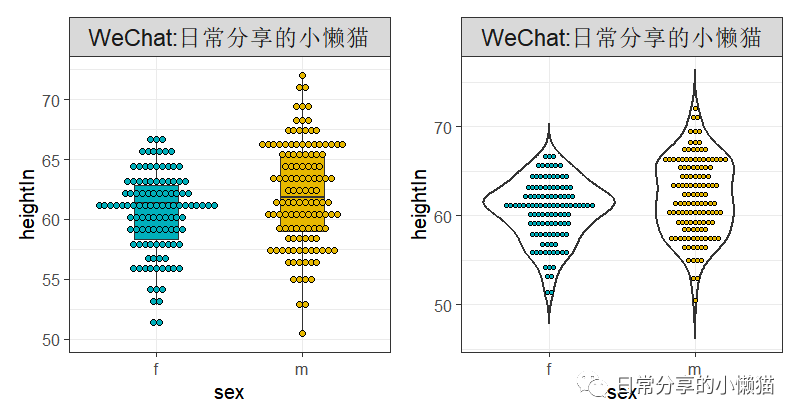
1、数据准备
> library(ggplot2)
> library(gcookbook)
> head(heightweight)
# sex ageYear ageMonth heightIn weightLb
#1 f 11.92 143 56.3 85.0
#2 f 12.92 155 62.3 105.0
#3 f 12.75 153 63.3 108.0
#4 f 13.42 161 59.0 92.0
#5 f 15.92 191 62.5 112.5
#6 f 14.25 171 62.5 112.0
> str(heightweight)
#'data.frame': 236 obs. of 5 variables:
# $ sex : Factor w/ 2 levels "f","m": 1 1 1 1 1 1 1 1 1 1 ...
# $ ageYear : num 11.9 12.9 12.8 13.4 15.9 ...
# $ ageMonth: int 143 155 153 161 191 171 185 142 160 140 ...
# $ heightIn: num 56.3 62.3 63.3 59 62.5 62.5 59 56.5 62 53.8 ...
# $ weightLb: num 85 105 108 92 112 ...复制
2、图形绘制
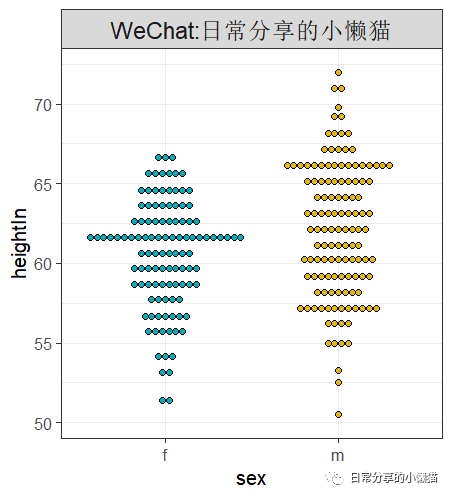
2.1 基础图形
ggplot(heightweight, aes(sex , heightIn , fill = sex)) +
geom_dotplot(binaxis = "y", stackdir = "center", dotsize = 0.6) +
scale_fill_manual(values = c("#00AFBB", "#E7B800")) +
theme_bw(base_size = 15) +
theme(legend.position = "none")复制
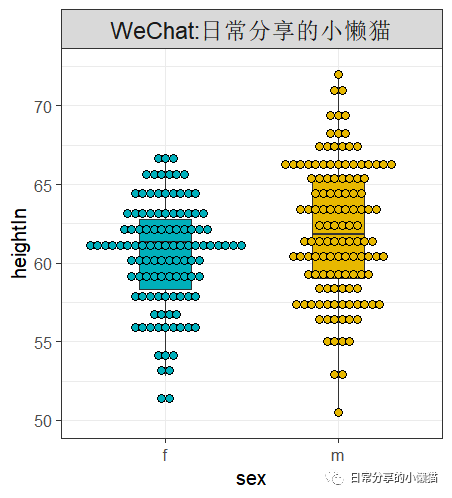
2.2 添加箱线图
ggplot(heightweight, aes(sex , heightIn , fill = sex)) +
geom_boxplot(width = 0.3, outlier.shape = NA) +
geom_dotplot(binaxis = "y", stackdir = "center", stackratio = 0.8, binwidth = 1, dotsize = 0.6) +
scale_fill_manual(values = c("#00AFBB", "#E7B800")) +
theme_bw(base_size = 15) +
theme(legend.position = "none")复制
2.3 添加小提琴图
ggplot(heightweight, aes(sex , heightIn , fill = sex)) +
geom_violin(trim = FALSE, fill = "transparent", linewidth = 1) +
geom_dotplot(binaxis = "y", stackdir = "center", stackratio = 0.8, binwidth = 1, dotsize = 0.6) +
scale_fill_manual(values = c("#00AFBB", "#E7B800")) +
theme_bw(base_size = 15) +
theme(legend.position = "none")复制

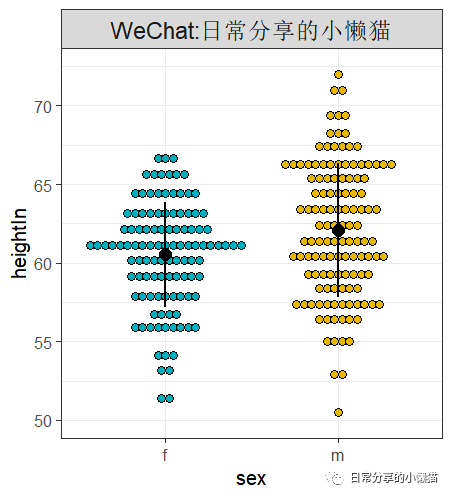
2.4 添加均值及±标准差
ggplot(heightweight, aes(sex , heightIn , fill = sex)) +
geom_dotplot(binaxis = "y", stackdir = "center", stackratio = 0.8, binwidth = 1, dotsize = 0.6) +
stat_summary(fun.data = "mean_sdl", fun.args = list(mult = 1), size = 1, linewidth = 1, color = "black") +
scale_fill_manual(values = c("#00AFBB", "#E7B800")) +
theme_bw(base_size = 15) +
theme(legend.position = "none")复制
3、其他
更多内容可关注微信公众号【日常分享的小懒猫】。
如有帮助请多多点赞哦!
文章转载自日常分享的小懒猫,如果涉嫌侵权,请发送邮件至:contact@modb.pro进行举报,并提供相关证据,一经查实,墨天轮将立刻删除相关内容。
