


Conditional Regression Rules.pdf
100墨值下载

Conditional Regression Rules
Rui Kang
BNRist, Tsinghua University
kr20@mails.tsinghua.edu.cn
Shaoxu Song
BNRist, Tsinghua University
sxsong@tsinghua.edu.cn
Chaokun Wang
BNRist, Tsinghua University
chaokun@tsinghua.edu.cn
Abstract—Mixed data distribution is widely observed, for
example, the bird migration data consist of the observed locations
of various birds in different years, varying in data distribution.
Learning a single regression model over such a mixed data
distribution is often ineffective, while manually segmenting the
data, e.g., by bird, date or region, for learning individual models
is truly labor-intensive. In this paper, we propose to automatically
discover the regression models that apply conditionally to only
apartofthedata,namelyconditional regression rules (CRRs),
enlightened by the conditional functional dependencies (CFDs)
that are FDs hold only in some data. Remarkably, a regression
model may apply in different parts of data, e.g., the seasonal
migration of birds is similar in different years. To capture
the shared regression models, we investigate the inference of
CRRs. An algorithm is devised to learn and discover CRRs from
data, with the help of CRR inference. Extensive experiments on
real-world datasets demonstrate that the discovered conditional
regression rules are more effective than the regression models
without conditions. In particular, with the inference of CRRs,
the number of learned CRRs is significantly reduced without
sacrificing rule semantics.
Index Terms—Integrity Constraint, Regression Model
I. INTRODUCTION
Mixed data distribution is widely observed. Making as-
sumptions such as mixed Gaussian distribution [1] is not
always valid in practice, e.g., in spatio-temporal data [2]. For
instance, the bird migration dataset BirdMap [3] consists of the
observed locations of various birds in different years, varying
in data distribution, as illustrated in Table I and Figure 1(a)
in Example 1 below. Our preliminary study [4] shows that
learning individual regression models for each tuple is accurate
and effective. Unfortunately, it is computational expensive and
not always necessary. As shown in Figure 1(b), a regression
model (lines with the same color) may apply to a set or
multiple isolated sets of data, not necessary to learn for each
individual tuple.
Example 1. Table I shows a fraction of the GPS locations of
different birds in several years from the BirdMap dataset [3].
Figure 1(a) visualizes part of the mixed data distribution,
where each point corresponds to a GPS record of the bird
2 .Maria. We use different colors to denote the data in different
seasons, showing the seasonal migration of a bird, which is
expected to be automatically discovered below.
This work is supported in part by the National Natural Science Founda-
tion of China (62072265, 62021002), the National Key Research and De-
velopment Plan (2021YFB3300500, 2019YFB1705301, 2019YFB1707001),
BNR2022RC01011, and the MIIT High Quality Development Program 2020.
Shaoxu Song is the corresponding author.
TABLE I
E
XAMPLE OF THE BIRDMAP DATASET
TID Latitude Longitude BirdID Date
t
1
56.20883 26.92067 2.Maria 2006-8-6
t
2
55.83867 26.2075 2.Maria 2006-8-7
t
3
21.988 22.56783 2.Maria 2007-8-28
t
4
53.04183 25.80183 3.Raivo 2007-3-30
t
5
47.39333 27.40033 1.Kalakotkas 2007-3-26
t
6
– – 2.Maria 2007-3-20
t
7
38.5855 28.040333 4.Mart 2007-9-11
t
8
38.58567 28.03583 4.Mart 2007-9-1
t
9
9.0155 20.07167 2.Maria 2008-8-27
t
10
6.7465 19.073 2.Maria 2007-9-4
t
11
58.61833 28.66967 33.Erika 2007-8-13
Regression models are learned over the data for various
applications, such as imputing the missing locations in t
6
in
Table I. To better illustrate the regression model, Figures 1(b)
and 1(c) plot Latitude and Longitude over Date, respectively.
The existing methods, such as [5], may learn the same
model multiple times in different parts of data. For example,
in Figure 1(b), it splits the domain of timestamp and learns
regression models separately, e.g., the red line denotes the
migration of the bird from north to south between 2006-8-
11 and 2006-9-12. Unfortunately, the same regression model
is redundantly learned again from 2008-8-18 to 2008-9-19,
since the birds travel seasonally in the same way.
Obviously, manually splitting the data, e.g., by bird, date or
region, for learning individual models is truly labor-intensive.
Motivated by the extended conditional functional dependencies
(eCFDs [6]) that introduce disjunctions to apply CFD to some
data, in this paper, we propose to automatically discover the
regression models that apply conditionally to some parts of
the data, namely conditional regression rules (CRRs).
Informally, a CRR ϕ is in a form of triple (f, ρ,C), where
f : X → Y is a regression function from attributes X to Y ,
ρ is the maximum bias between the attribute value of Y and
prediction f(X), and C specifies the conditions. Motivated
by denial constraints (DCs) [7], we use predicates to form
conjunction and disjunction to specify the parts of data where
a CRR conditionally applies.
Example 2 (Example 1 continued). For the light-blue points
with Date from 2006-8-11 to 2006-9-12, a CRR ϕ
1
is observed
2482
2022 IEEE 38th International Conference on Data Engineering (ICDE)
2375-026X/22/$31.00 ©2022 IEEE
DOI 10.1109/ICDE53745.2022.00231
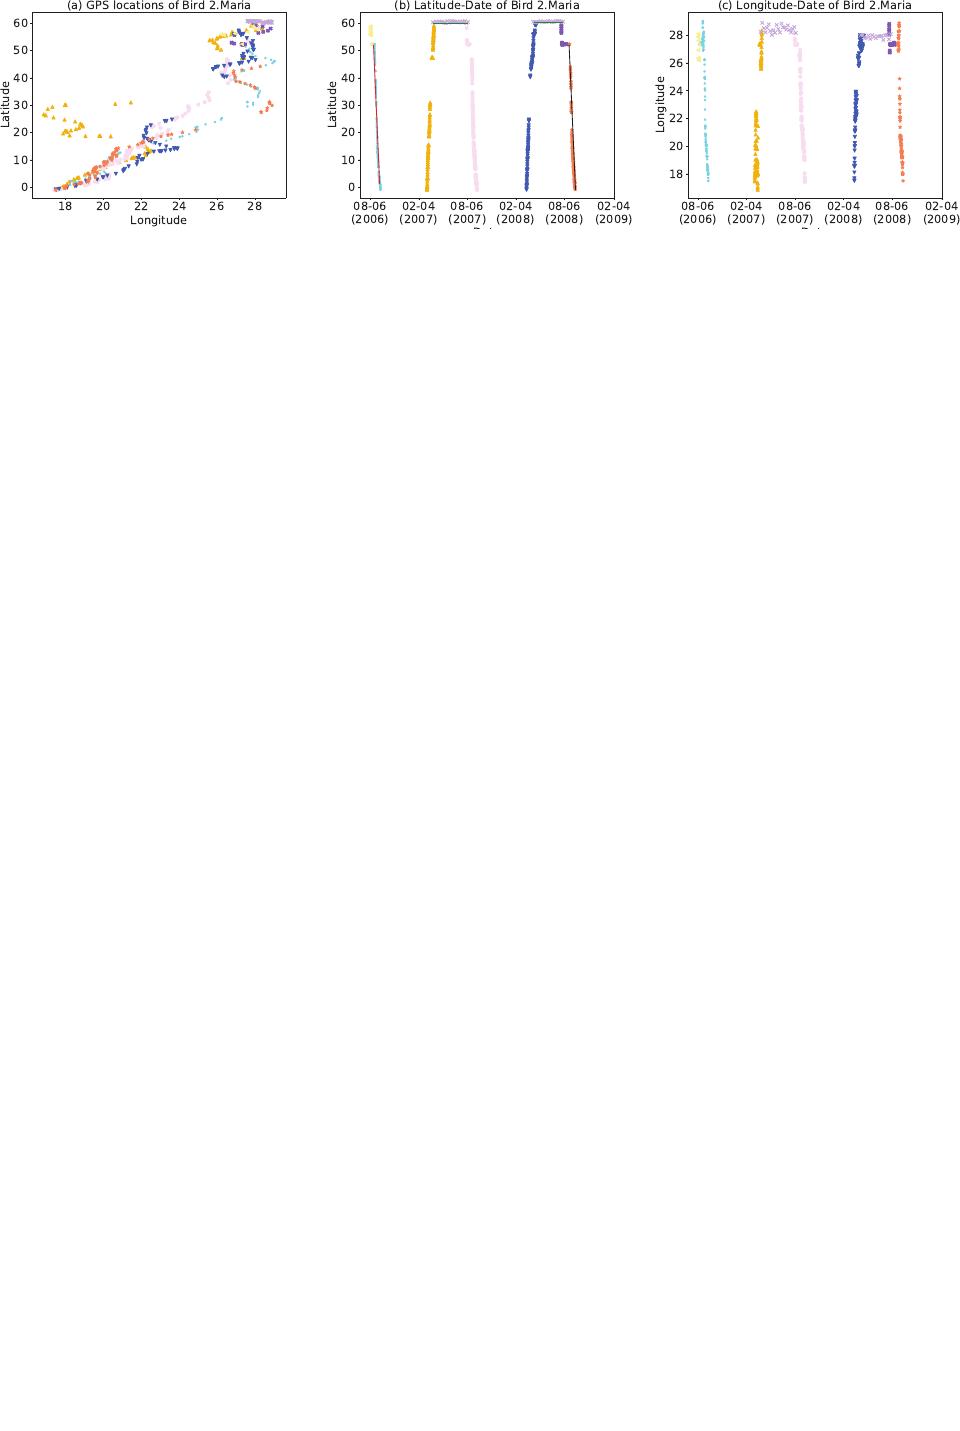
Fig. 1. Regression models conditionally apply to parts of the BirdMap data
in Figure 1(b).
ϕ
1
:f
1
(Date)=Latitude,ρ
1
=0.5,
C
1
=(Date ≥ 2006-8-11 ∧ Date < 2006-9-12)
It denotes that the linear regression f
1
with the maximum
bias |Latitude − f
1
(Date)|≤ρ
1
applies to the tuples with
Date ≥ 2006-8-11 ∧ Date < 2006-9-12.
The following CRR ϕ
2
applies to different parts of the data,
from 2007-4-1 to 2007-8-8, as well as 2008-4-13 to 2008-7-31,
denoted by disjunction in the condition C
2
.
ϕ
2
: f
2
(Date)=Latitude,ρ
2
=0.5, C
2
=(Latitude =60.10∧
((Date ≥ 2007-4-1 ∧ Date < 2007-8-8)∨
(Date ≥ 2008-4-13 ∧ Date < 2008-7-31)))
Analogous to CFDs specifying conditions on the dependent Y
[8], the constant Latitude =60.10 states that the prediction
should always be 60.10 with the maximum bias ρ
2
=0.5.It
denotes that the bird stays in the location of the same Latitude
from April to August each year.
While CRRs such as ϕ
2
can be directly shared among dif-
ferent parts of the data, some others need translation. To share
the aforesaid f
1
in another year, from 2008-8-18 to 2008-9-
19, translation is needed, i.e., f
1
(Date−x)=Latitude, where
x = 744 denotes the difference in date between two years.
ϕ
3
: f
1
(Date − x)=Latitude,ρ
3
=0.5, C
3
=
((Date ≥ 2006-8-11 ∧ Date < 2006-9-12 ∧ x =0)∨
(Date ≥ 2008-8-18 ∧ Date < 2008-9-19 ∧ x = 744))
It is worth noting that ϕ
3
subsumes the semantics of ϕ
1
given x =0, i.e., using ϕ
3
is sufficient in practice and ϕ
1
is redundant.
The novelty of our CRR is thus to share the same regression
model in different parts of data, specified by conditions. With
model sharing, both the learning and evaluation of regression
models could be improved. For example, in Figure 1(b), since
the regression model f
1
in red line learned from 2006-8-11 to
2006-9-12 can also be applied in the time period from 2008-8-
18 to 2008-9-19, it does not need to be learned again, reducing
the learning time cost. As the number of the rules is reduced,
the evaluation time cost of the models is improved as well.
A. Challenges
Different from the existing studies for learning regression
models [9]–[13], the main challenge of learning CRRs origi-
nates from the huge space of possible conditions, with disjunc-
tion and conjunction of predicates. In particular, regression
models may be shared in different parts of data, specified
by different conditions, such as ϕ
2
in Example 2. Moreover,
some regression models might not be directly shared but with
translation, e.g., translated from ϕ
1
to ϕ
3
.
B. Contributions
In this paper, we will provide a deep insight into the problem
of learning and inferring conditional regression rules. Our
major contributions in this study are summarized as follows:
(1) We present a novel form of conditional regression rule
(CRR) with disjunctions to capture the sharing of regression
models among different parts of data, in Section III.
(2) We investigate the soundness of five inference rules
for CRRs, in Section IV, which could be used to reduce the
number of CRRs with shared models.
(3) We devise an algorithm to learn and discover CRRs from
data, in Section V, where model sharing further improves the
discovery time performance by avoiding redundant learning.
(4) We compare with strong baselines, in Section VI, to
demonstrate the reduced number of regression rules and time
performance without sacrifice of RMSE by model sharing.
II. R
ELATED WORK
Our proposed CRR is motivated by both the integrity
constraints and regression models that apply to part of the
data, discussed in Sections II-A and II-B, respectively.
A. Conditions for Integrity Constraints
Integrity constraints apply conditions to build data models
such as CFD [6], [8], [14], [15] and CDD [16], [17]. Different
from other existing conditional integrity rules, CRR only
considers single tuple relationship among attributes, which
does not rely on the existence of other tuples. Moreover, CRR
applies disjunctions based on predicates to form the condition,
integrating multiple parts of data. Based on predicates, denial
constraints (DCs) [7] define the false-negative part of data.
2483

Different from denial constraints, CRRs generate regression
models and use predicates for true-positive data partitions. In
this way, CRRs provide precise models in integrity constraints
for mixed data distribution.
B. Conditions for Regression Models
In general, our idea of model sharing is complementary
to the existing models, such as logistic regression [18], by
introducing the conditions for shared models in different parts
of data. Conditional logistic regression [19], [20] trains logistic
regression models over the part of data according to conjunc-
tion. However, model sharing is not studied, which is enabled
by DNF conditions in our CRR. Conditional regression forest
[21] builds an additive model to average the predictions from
multiple regression trees, each of which is trained through
data sampling from the same training set, leading to redundant
regression models. Again, the model sharing is not studied.
C. Conditions for Time Series Analysis
For time-series analysis/forecasting, regression models are
also considered, such as harmonic regression [22]. The har-
monic regression [22] fits data by cosine functions and use
different Fourier frequencies to capture short- and long-term
periodic features of the whole dataset. In contrast, we use
conditions to specify the periods, and thus enable model
sharing. Recurrence time modeling [23] uses random variable
T
j
to represent the period and learn regression models over
each period. Again, model sharing is not supported, the main
motivation and novelty of our study.
III. D
EFINITION
In this section, we introduce the definitions of each com-
ponent of CRRs formally in Section III-A. Then, we have the
semantics and formal definition of CRRs in Section III-B.
A. Preliminaries
We start with the formal definition of predicate p, condition
C, regression function f, regression bias ρ in Section III-A1,
Section III-A2, Section III-A3 and Section III-A4, respectively.
The CRRs are considered over a relational database
D. The database D is a collection of tuples of schema
R(A
1
, ...A
n
), attr(R)={A
1
, ...A
n
} as data samples from
mixed data distribution. Given tuple t ∈ D, we denote
t.A
i
= t[A
i
] as the value of attribute A
i
in tuple t.
1) Predicates p: As shown in Figure 1(b) and Example 2,
a conjunction of predicates could describe a simple set of data
for conditional regression model. Consider a set of operators
Φ={=,>,≥,<,≤}, the predicate space P contains a set
of single tuple predicates p with p := Aφc, where φ ∈ Φ
and A ∈ attr(R), c as a constant from the domain of A.As
the usability of function translation illustrated by ϕ
3
,wealso
have built-in predicates x =Δ,y = δ telling the parameter
of function translation in P defined in Section III-A3. Given
tuple t, assume that t is satisfied by any built-in predicates,
we have t p iff t.Aφc.
2) Conditions C: For describing simple part of data, e.g.,
light-blue part of data in Figure 1, a conjunction C
i
connects
a set of predicates pred (C
i
) ⊆ P with the conjunction i.e.,
C
i
:
p∈pred (C
i
)
p.
For each tuple t,wehavet C
i
iff ∀p ∈ pred(C
i
),t p.
Mixed data distributions may vary in the shape of data,
and the same distribution could be shared over more complex
data sets, e.g., the horizontal green lines in Figure 1 (b).
Thereby, we use a disjunction normal form (DNF) composed
by countable conjunctions C
1
...C
n
, i.e.,
C =(
p∈pred(C
1
)
p) ∨ ... ∨ (
p∈pred (C
n
)
p).
For each tuple t and the DNF condition C,wehavet C iff
∃C
i
,t C
i
. Given the condition C and instance I ⊆ D,we
denote I
C
as the subset of tuples in instance I with each tuple
satisfying condition C.
3) Regression f: Observing in Example 1 and Figure
1(b), each curve corresponds to a regression function f that
predicts the Latitude of a bird in a time slice. We have the
definition of regression function as follows. Given attributes
X ⊂ attr (R), built-in variables B = {x,y} and regression
target Y ∈ attr(R), a regression function f : X, B → Y
generates predictions with
Y = f (X + x)+y = f(X
1
+ x
1
, ...)+y.
For built-in variables in f,thevalueofx,y is defined
by built-in predicates x =Δ,y = δ associated with the
conjunction of each part of data, where the constant Δ
i
is
one of the differences between two values in the domain of
X
i
∈ X, and so as the constant δ of target Y . Thus, the
constants Δ and δ denote the difference of translating one tuple
to another. In Example 2, the data in Date ≥ 725∧Date < 769
is associated with built-in predicates d = 725 in condition,
representing the difference between two data parts on applying
model f
1
.
4) Bias ρ: In Figure 1(b), slight differences are observed
between f (Date) and t.Latitude even if the model f is fine-
tuned. In Table I, the precision of the GPS value of each
tuple is limited, e.g., for predicting Latitude, the precision
10
−3
should be a lower bound of bias ρ. Thus, to decide
the bias ρ for regression function f and target value Y ,
we consider both the precision of attribute Y and model
bias max
t
|t.Y − f(t.X)|. The regression model of data is
composed of regression function f and bias ρ, denoted by
(f,ρ).
B. Semantics
The regression model (f,ρ) with f : X, B → Y estimates
the target value Y based on attributes X ⊂ attr(R) under
some data by the regression function f and bias ρ. Thus,
to capture the semantic relationship between the conditions
to some data and the regression models, we introduce the
definition of CRR.
2484
of 13
100墨值下载
【版权声明】本文为墨天轮用户原创内容,转载时必须标注文档的来源(墨天轮),文档链接,文档作者等基本信息,否则作者和墨天轮有权追究责任。如果您发现墨天轮中有涉嫌抄袭或者侵权的内容,欢迎发送邮件至:contact@modb.pro进行举报,并提供相关证据,一经查实,墨天轮将立刻删除相关内容。
最新上传
下载排行榜
1
2
9-数据库人的进阶之路:从PG分区、SQL优化到拥抱AI未来(罗敏).pptx
3
1-PG版本兼容性案例(彭冲).pptx
4
2-TDSQL PG在复杂查询场景中的挑战与实践-opensource.pdf
5
6-PostgreSQL 哈希索引原理浅析(文一).pdf
6
3-AI时代的变革者-面向机器的接口语言(MOQL)_吕海波.pptx
7
8-基于PG向量和RAG技术的开源知识库问答系统MaxKB.pptx
8
4-IvorySQL V4:双解析器架构下的兼容性创新实践.pptx
9
7-拉起PG好伙伴DifySupaOdoo.pdf
10
《云原生安全攻防启示录》李帅臻.pdf

相关文档
评论