


Largest Triangle Sampling for Visualizing Time Series in Database.pdf
100墨值下载

Largest Triangle Sampling for Visualizing Time Series in
Database
LEI RUI, Tsinghua University, China
XIANGDONG HUANG, Tsinghua University, China
SHAOXU SONG
∗
, Tsinghua University, China
CHEN WANG, Tsinghua University, China
JIANMIN WANG, Tsinghua University, China
ZHAO CAO, Huawei Technologies Co., Ltd, China
In time series visualization, sampling is used to reduce the number of points while retaining the visual features
of the raw time series. Area-based Largest Triangle Sampling (LTS) excels at preserving perceptually critical
points. However, the heuristic solution to LTS by sequentially sampling points with the locally largest triangle
area (a.k.a. Largest-Triangle-Three-Buckets, LTTB) suers from suboptimal solution and query ineciency.
We address the shortcomings by contributing a novel Iterative Largest Triangle Sampling (ILTS) algorithm
with convex hull acceleration. It renes the sampling results iteratively, capturing a broader perspective
by integrating more points in each iteration. Remarkably, we prove that the largest triangle can always be
found in the precomputed convex hulls, making the iterative sampling still ecient. Experiments demonstrate
increased visual quality over state-of-the-art baselines and signicant speedups over the brute force approach.
CCS Concepts: • Information systems → Database query processing.
Additional Key Words and Phrases: time series visualization, database query processing
ACM Reference Format:
Lei Rui, Xiangdong Huang, Shaoxu Song, Chen Wang, Jianmin Wang, and Zhao Cao. 2025. Largest Trian-
gle Sampling for Visualizing Time Series in Database. Proc. ACM Manag. Data 3, 1 (SIGMOD), Article 49
(February 2025), 26 pages. https://doi.org/10.1145/3709699
1 Introduction
Time series visualization, often represented by line charts [
7
], is extensively used. A contemporary
visualization system consists of a back-end database server and a front-end visualization client.
However, a naïve technique where the client queries the raw time series from the database fails to
meet the rapid response time requirements, due to the large amounts of data transferred. Therefore,
it is necessary to reduce the number of data points in the query result set, which can be accomplished
by replacing raw data queries with sampling queries [
27
]. An ideal sampling query should meet
two requirements: visual quality and query eciency.
∗
Shaoxu Song (https://sxsong.github.io/) is the corresponding author.
Authors’ Contact Information: Lei Rui, Tsinghua University, Beijing, China, rl18@mails.tsinghua.edu.cn; Xiangdong Huang,
Tsinghua University, Beijing, China, huangxdong@tsinghua.edu.cn; Shaoxu Song, Tsinghua University, Beijing, China,
sxsong@tsinghua.edu.cn; Chen Wang, Tsinghua University, Beijing, China, wang_chen@tsinghua.edu.cn; Jianmin Wang,
Tsinghua University, Beijing, China, jimwang@tsinghua.edu.cn; Zhao Cao, Huawei Technologies Co., Ltd, Beijing, China,
caozhao1@huawei.com.
This work is licensed under a Creative Commons Attribution International 4.0 License.
© 2025 Copyright held by the owner/author(s). Publication rights licensed to ACM.
ACM 2836-6573/2025/2-ART49
https://doi.org/10.1145/3709699
Proc. ACM Manag. Data, Vol. 3, No. 1 (SIGMOD), Article 49. Publication date: February 2025.
49:2 Lei Rui et al.
(a) Raw
SSIM=0.18
p
4
p
5
p
7
p
8
(b) Extrema-based M4
SSIM=0.54
A
(c) Segment-based FSW
SSIM=0.76
q
1
q
2
q
3
q
4
q
5
q
6
q
7
q
8
B
2
B
3
B
4
B
5
B
6
B
7
(d) Area-based LTS
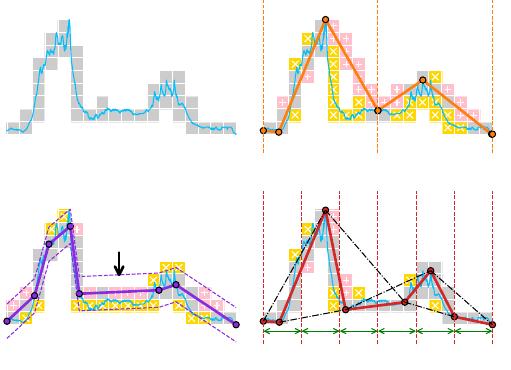
Fig. 1. Motivation of area-based sampling. Gray squares denote the pixels ploed by the raw data without
sampling, i.e., (a) ground truth. Comparing (b)-(d) with (a), pink pixels (with "+" markers) indicate those
ploed by the sampled data but not by the raw time series, while yellow pixels (with "x" markers) are marked
in ground truth but not by the sampled 8 points, both the fewer the beer.
1.1 Motivation
The Structural SIMilarity (SSIM) index (SSIM) is a widely used metric for assessing visual quality
[
19
,
27
,
31
,
37
,
38
], with higher scores for better quality. Figure 1 shows some typical methods that
plot a time series in 18 pixel columns, with/without sampling.
Ideally, M4 [
27
] selects
𝑚 =
4
𝑤
points from
𝑤
buckets that align with the pixel column time
intervals, ensuring error-free visualization when rendered on a canvas with the target width
𝑤
.
However, user operations (e.g., resizing) and multiple physical screens (e.g., those on watches,
phones and computers) may lead to various canvas width
𝑤
, making the number of sampled data
points
𝑚
not exactly match the width
𝑤
. When such a mismatch occurs, even slightly, the visual
quality of M4 can deteriorate signicantly. This degradation happens because the sampled points
are tailored for line rasterization and become less eective, when the bucketing does not align with
the pixel columns.
By selecting points that maximize the triangle area, perceptually critical points [
9
,
29
] can be
identied. For example, in Figure 1(d), the inection point
𝑞
5
forms the largest triangle with its
neighbors
𝑞
4
and
𝑞
6
, and is selected by the area-based Largest Triangle Sampling (LTS) method (see
Section 2 for the formal denition). Such inection points eectively capture the change in trends
before and after the inection, leading to high structural similarity on pixels in the SSIM metric.
Unlike extrema-based methods which select horizontal or vertical extrema per bucket, area-based
sampling can identify critical points that are not extrema. For example, the critical turning point
𝑞
5
sampled by LTS cannot be captured by the extrema-based method in Figure 1(b).
For segment-based methods, the goal of small distances in the data space (i.e., small y-dierences)
does not necessarily correspond to small distances in the pixel space. For example, Feasible Space
Window (FSW) [
30
] in Figure 1(c) is an error-bounded piecewise linear approximation (
ℓ
∞
-PLA)
method that greedily maximizes the segment length while bounding the y-dierence of each point.
The points are close to segment A in terms of y-dierences, whereas the corresponding plotted
pixels are distinct, i.e., low SSIM.
Proc. ACM Manag. Data, Vol. 3, No. 1 (SIGMOD), Article 49. Publication date: February 2025.
Largest Triangle Sampling for Visualizing Time Series in Database 49:3
B
2
(a)
q
1
q
1
2
q
0
3
B
3
(b)
q
1
2
q
1
3
q
0
4
B
4
(c)
q
1
3
q
1
4
q
0
5
B
5
anchor floater
(d)
q
1
4
q
1
5
q
0
6
B
6
(e)
q
1
5
q
1
6
q
0
7
B
7
(f)
q
1
6
q
1
7
q
8
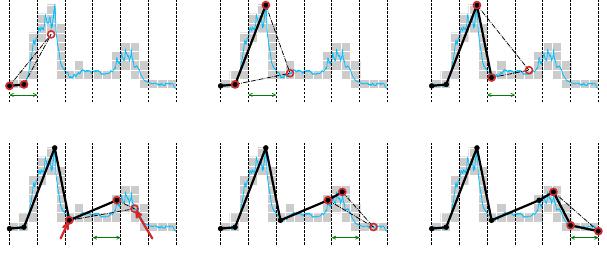
Fig. 2. Largest-Triangle-Three-Buckets (LTTB)
1.2 Challenge
Computing the LTS is obviously costly and not aordable, given various combinations of sampled
points to form triangles. A linear-time approximation to the LTS problem, known as Largest-
Triangle-Three-Buckets (LTTB) [
34
], sequentially samples points from left to right buckets. For
each bucket, it selects the point that maximizes the triangle area formed with left anchor
𝑙
and
right oater 𝑟. Finally, all the anchor points constitute the sampling result.
As shown in Figure 2, for the current bucket being sampled, the term "left anchor" refers to the
sampled point in the left bucket, which has already been determined. The term "right oater" is
used because the sampled point in the right bucket has not yet been determined and is temporarily
substituted by the average of the data points in the right bucket.
Yet LTTB remains shortsighted despite using adjacent buckets. First, the previous sampling
errors in the left will aect the following ones. Moreover, the incoming points from further behind
the right adjacent bucket will not aect the currently sampled point. Consequently, as shown in
Figure 2(d), LTTB returns
𝑞
1
5
of bucket
𝐵
5
and misses the critical turning point
𝑞
5
as in Figure 1(d).
Using the average point
𝑞
0
6
in bucket
𝐵
6
as the right oater, LTTB does not realize that there are
higher peaks behind bucket 𝐵
5
.
On the other hand, the query eciency issue of LTTB is underestimated, especially in IoT
scenarios. A time series is often segmented and stored in dispersed disk pages (see Section 5.2).
Consequently, even a simple linear scan can be costly due to random I/O. Precomputation is often
used for query acceleration, e.g., by pre-aggregating sums and counts to enable faster average
calculations. Unfortunately, the triangle area formed by each point and its anchor-oater cannot be
calculated in advance, because the oater varies with distinct bucketing specied by online queries.
1.3 Intuition
To address both challenges in visual quality and query eciency, we propose a novel Iterative
Largest Triangle Sampling (ILTS) algorithm with convex hull acceleration. Instead of relying one
time on the xed anchor and oater like LTTB does, ILTS iteratively uses the latest sampled points
to rene the sampling results.
The rationale behind this iterative renement is the propagation of the inuence of points over
iterations, both forward and backward, for a holistic view in visualization. As veried in Figure 3(c),
ILTS uses the sampled point
𝑞
1
6
in
𝐵
6
during the rst iteration as the right oater
𝑟
and succeeds in
Proc. ACM Manag. Data, Vol. 3, No. 1 (SIGMOD), Article 49. Publication date: February 2025.
of 26
100墨值下载
【版权声明】本文为墨天轮用户原创内容,转载时必须标注文档的来源(墨天轮),文档链接,文档作者等基本信息,否则作者和墨天轮有权追究责任。如果您发现墨天轮中有涉嫌抄袭或者侵权的内容,欢迎发送邮件至:contact@modb.pro进行举报,并提供相关证据,一经查实,墨天轮将立刻删除相关内容。
最新上传

相关文档
评论