


「目录」
绘图和可视化
Plotting and Visualization
9.1 => matplotlib
-------> figure and subplot
9.2 => pandas和seaborn绘图

matplotlib
作者原书中写道,matplotlib是一个用于创建出版质量图表的绘图包(主要是2D方面)。
该项目是John Hunter于2002年启动的,其目的是为Python构建一个MATLAB式的绘图接口。
随着时间发展,matpotlib衍生出了多个数据可视化的工具集,它们使用matplotlib作为底层。其中之一是seaborn。
matplotlib约定的引入方式是下面这样的:
import matplotlib.pyplot as plt复制
首先,建议在Jupyter notebook中执行下面的语句,这样就可以在jupyter notebook中进行交互式绘图了:
%matplotlib notebook复制
先做一个简单的线图吧:
In [1]: import matplotlib.pyplot as plt
In [2]: import numpy as np
In [3]: data = np.arange(10)
In [4]: data
Out[4]: array([0, 1, 2, 3, 4, 5, 6, 7, 8, 9])
In [5]: plt.plot(data)复制
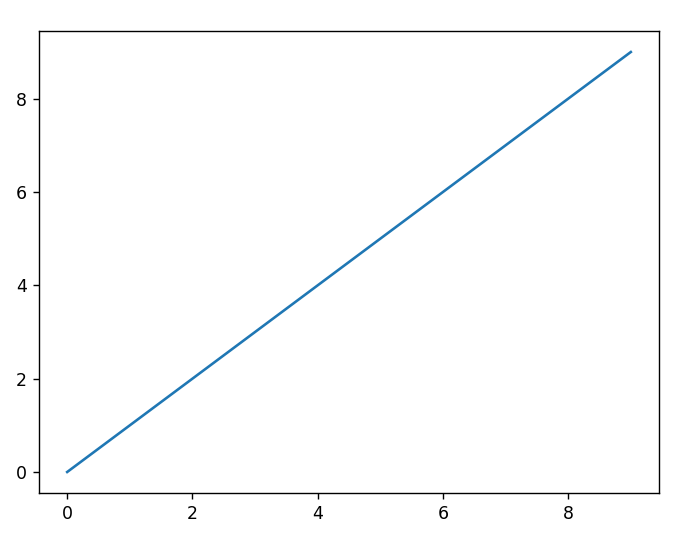
Figure and Subplot
matplotlib的图像都位于Figure对象中。我们可以用plt.figure创建一个新的Figure:
In [6]: fig = plt.figure()复制
plt.figure()中有一些选项比如figsize可以设置图片的大小和纵横比。
通过add_subplot我们可以在空白的figure上创建一个或多个subplot子图:
In [7]: ax1 = fig.add_subplot(2, 2, 1)
In [8]: ax2 = fig.add_subplot(2, 2, 2)
In [9]: ax3 = fig.add_subplot(2, 2, 3)复制
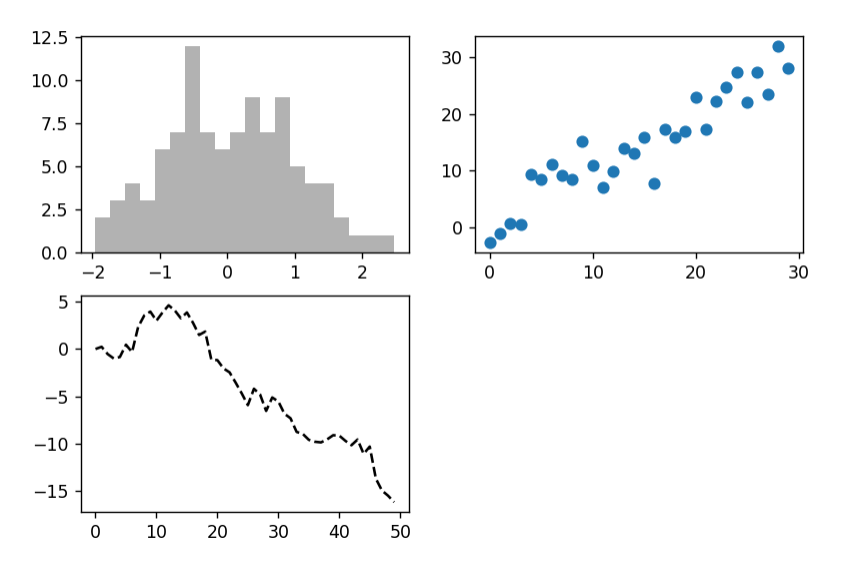
上面代码的意思是,创建2*2的图像(最多4张图),第3个参数代表当前选中的是第几个图。
ax1.hist代表第一张图为柱状图,ax2.scatter代表第二张图为散点图,ax3.plot代表第三张图为折线图,color参数就是颜色,alpha参数为透明度:
In [10]: _ = ax1.hist(np.random.randn(100), bins=20, color='k', alpha=0.3)
In [11]: ax2.scatter(np.arange(30), np.arange(30) + 3 * np.random.randn(30))
In [12]: ax3.plot(np.random.randn(50).cumsum(), 'k--')复制
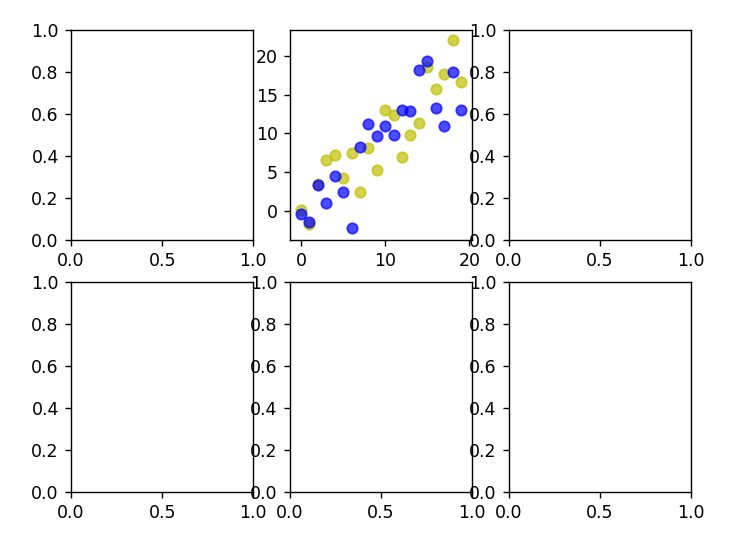
更方便的创建网格的方法是使用方法plt.subplots,它会创建一个新的Figure,并返回一个含有已创建的subplot对象的Numpy数组:
In [13]: fig, axes = plt.subplots(2, 3)
In [14]: axes
Out[14]:
array([[<matplotlib.axes._subplots.AxesSubplot object at 0x000001CFAF06DEB8>,
<matplotlib.axes._subplots.AxesSubplot object at 0x000001CFAF096048>,
<matplotlib.axes._subplots.AxesSubplot object at 0x000001CFAF0C5160>],
[<matplotlib.axes._subplots.AxesSubplot object at 0x000001CFAF234278>,
<matplotlib.axes._subplots.AxesSubplot object at 0x000001CFAF260390>,
<matplotlib.axes._subplots.AxesSubplot object at 0x000001CFAF2924A8>]],
dtype=object)复制
现在通过对axes数组进行索引就可以方便的绘图了:
In [15]: axes[0,1].scatter(np.arange(20), np.arange(20) + 3 * np.random.randn(20), color='y', alpha=0.7)
Out[15]: <matplotlib.collections.PathCollection at 0x1cfaf039978>
In [16]: axes[0,1].scatter(np.arange(20), np.arange(20) + 3 * np.random.randn(20), color='b', alpha=0.7)
Out[16]: <matplotlib.collections.PathCollection at 0x1cfaf2de240>复制
现在是晚上11点多了,明天再继续吧,BYE-BYE !
!
往期回顾


Stay hungry, stay foolish

