


1、安装模块
1!pip install PyKrige
2!pip install plotnine
3!pip install openpyxl
2、导入模块
 1import pandas as pd
 2from pykrige.ok import OrdinaryKriging
 3import plotnine
 4from plotnine import *
 5import geopandas as gpd
 6import shapefile
 7import matplotlib.pyplot as plt
 8import cartopy.crs as ccrs
 9import cartopy.io.shapereader as shpreader
10import cmaps
11from matplotlib.path import Path
12from matplotlib.patches import PathPatch
3、读取数据
1df = pd.read_excel('/home/mw/input/meiyu6520/meiyu_sh_2020.xlsx')
2df
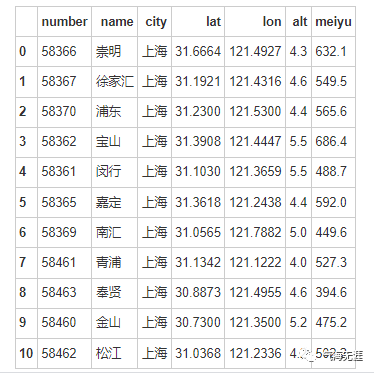
1# 读取站点经度
2lons = df['lon']
3# 读取站点纬度
4lats = df['lat']
5# 读取梅雨量数据
6data = df['meiyu']
7# 生成经纬度网格点
8grid_lon = np.linspace(120.8, 122.1,1300)
9grid_lat = np.linspace(30.6, 31.9,1300)
4、克里金(Kriging)插值
1OK = OrdinaryKriging(lons, lats, data, variogram_model='gaussian',nlags=6)
2z1, ss1 = OK.execute('grid', grid_lon, grid_lat)
3z1.shape
1(1300, 1300)
转换成网格
1xgrid, ygrid = np.meshgrid(grid_lon, grid_lat)
将插值网格数据整理
1df_grid = pd.DataFrame(dict(long=xgrid.flatten(),lat=ygrid.flatten()))
添加插值结果
1df_grid["Krig_gaussian"] = z1.flatten()
2df_grid
输出:
 1long    lat Krig_gaussian
 20    121.000000  30.5    541.076134
 31    121.020408  30.5    540.997891
 42    121.040816  30.5    540.770766
 53    121.061224  30.5    540.381399
 64    121.081633  30.5    539.818047
 7...    ... ... ...
 82495    121.918367  31.5    567.391506
 92496    121.938776  31.5    562.730899
102497    121.959184  31.5    558.418169
112498    121.979592  31.5    554.460195
122499    122.000000  31.5    550.857796
132500 rows × 3 columns
5、读取上海的行政区划
1sh = gpd.read_file('/home/mw/input/meiyu6520/Shanghai.shp')
2sh
输出:
 1City    District    Province    Code    geometry
 20    上海市 普陀区 上海市 310107  POLYGON ((121.35622 31.23362, 121.35418 31.237...
 31    上海市 宝山区 上海市 230506  POLYGON ((121.48552 31.31156, 121.48541 31.311...
 42    上海市 崇明区 上海市 310151  MULTIPOLYGON (((121.87022 31.29554, 121.86596 ...
 53    上海市 奉贤区 上海市 310120  POLYGON ((121.56443 30.99643, 121.57047 30.998...
 64    上海市 虹口区 上海市 310109  POLYGON ((121.46828 31.31520, 121.46831 31.316...
 75    上海市 黄浦区 上海市 310101  POLYGON ((121.48781 31.24419, 121.49483 31.242...
 86    上海市 嘉定区 上海市 310114  POLYGON ((121.33689 31.29506, 121.33650 31.294...
 97    上海市 金山区 上海市 310116  POLYGON ((121.00206 30.95104, 121.00764 30.947...
108    上海市 静安区 上海市 310106  POLYGON ((121.46808 31.32032, 121.46809 31.320...
119    上海市 闵行区 上海市 310112  POLYGON ((121.33689 31.23674, 121.33835 31.237...
1210    上海市 浦东新区    上海市 310115  MULTIPOLYGON (((121.97077 31.15756, 121.96568 ...
1311    上海市 青浦区 上海市 310118  POLYGON ((121.31900 31.15867, 121.31953 31.157...
1412    上海市 松江区 上海市 310117  POLYGON ((121.02906 30.94388, 121.02804 30.943...
1513    上海市 徐汇区 上海市 310104  POLYGON ((121.45800 31.21929, 121.45807 31.219...
1614    上海市 杨浦区 上海市 310110  POLYGON ((121.52288 31.34289, 121.52549 31.346...
1715    上海市 长宁区 上海市 310105  POLYGON ((121.43938 31.21444, 121.43946 31.214...
绘图:
1sh.plot()

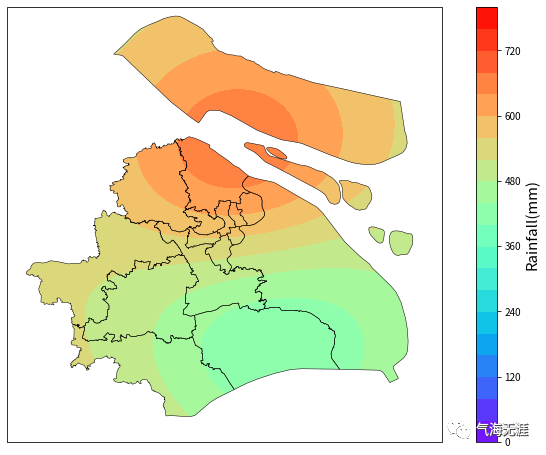
6、插值结果可视化
 1fig = plt.figure(figsize=(12, 8))
 2ax = fig.add_subplot(1, 1, 1, projection=ccrs.PlateCarree())
 3ax.set_extent([120.8, 122.1, 30.6, 31.9], crs=ccrs.PlateCarree())
 4
 5province = shpreader.Reader('/home/mw/input/meiyu6520/Shanghai.shp')
 6ax.add_geometries(province.geometries(), crs=ccrs.PlateCarree(), linewidths=0.5,edgecolor='k',facecolor='none')
 7
 8cf = ax.contourf(xgrid, ygrid, z1, levels=np.linspace(0,800,21), cmap=cmaps.MPL_rainbow, transform=ccrs.PlateCarree())
 9
10def shp2clip(originfig, ax, shpfile):
11    sf = shapefile.Reader(shpfile)
12    vertices = []
13    codes = []
14    for shape_rec in sf.shapeRecords():
15        pts = shape_rec.shape.points
16        prt = list(shape_rec.shape.parts) + [len(pts)]
17        for i in range(len(prt) - 1):
18            for j in range(prt[i], prt[i + 1]):
19                vertices.append((pts[j][0], pts[j][1]))
20            codes += [Path.MOVETO]
21            codes += [Path.LINETO] * (prt[i + 1] - prt[i] - 2)
22            codes += [Path.CLOSEPOLY]
23        clip = Path(vertices, codes)
24        clip = PathPatch(clip, transform=ax.transData)
25    for contour in originfig.collections:
26        contour.set_clip_path(clip)
27    return contour
28
29shp2clip(cf, ax, '/home/mw/input/meiyu6520/Shanghai.shp')
30
31cb = plt.colorbar(cf)
32cb.set_label('Rainfall(mm)',fontsize=15)
33
34plt.show()
有问题可以到QQ群里进行讨论,我们在那边等大家。
QQ群号:854684131
文章转载自气海无涯,如果涉嫌侵权,请发送邮件至:contact@modb.pro进行举报,并提供相关证据,一经查实,墨天轮将立刻删除相关内容。
