


点击下方公众号,回复资料,收获惊喜
风玫瑰是由气象学家用于给出如何风速和风向在特定位置通常分布的简明视图的图形工具。它也可以用来描述空气质量污染源。风玫瑰工具使用Matplotlib作为后端。
安装方式直接使用pip install windrose
导入模块
import pandas as pd
import numpy as np
from matplotlib import pyplot as plt
import matplotlib.cm as cm
from math import pi
import windrose
from windrose import WindroseAxes, WindAxes, plot_windrose
from mpl_toolkits.axes_grid1.inset_locator import inset_axes
import cartopy.crs as ccrs
import cartopy.io.img_tiles as cimgt复制
读取数据
df = pd.read_csv("./sample_wind_poitiers.csv", parse_dates=['Timestamp'])
df = df.set_index('Timestamp')复制
计算风速的u、v分量
df['speed_x'] = df['speed'] * np.sin(df['direction'] * pi / 180.0)
df['speed_y'] = df['speed'] * np.cos(df['direction'] * pi / 180.0)复制
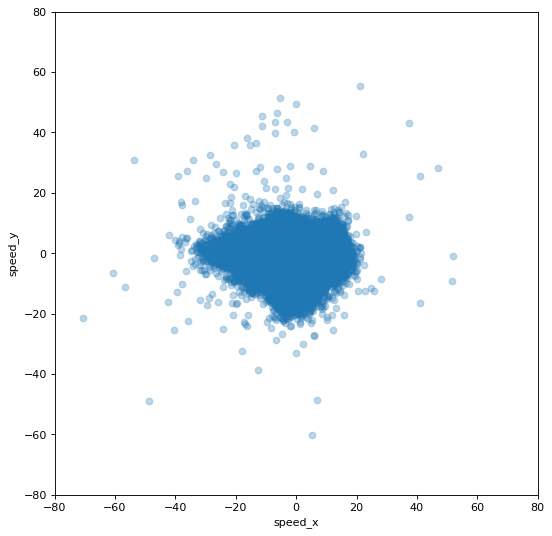
uv风速散点图(含透明度)
fig, ax = plt.subplots(figsize=(8, 8), dpi=80)
x0, x1 = ax.get_xlim()
y0, y1 = ax.get_ylim()
ax.set_aspect(abs(x1-x0)/abs(y1-y0))
ax.set_aspect('equal')
ax.scatter(df['speed_x'], df['speed_y'], alpha=0.25)
df.plot(kind='scatter', x='speed_x', y='speed_y', alpha=0.05, ax=ax)
Vw = 80
ax.set_xlim([-Vw, Vw])
ax.set_ylim([-Vw, Vw])复制
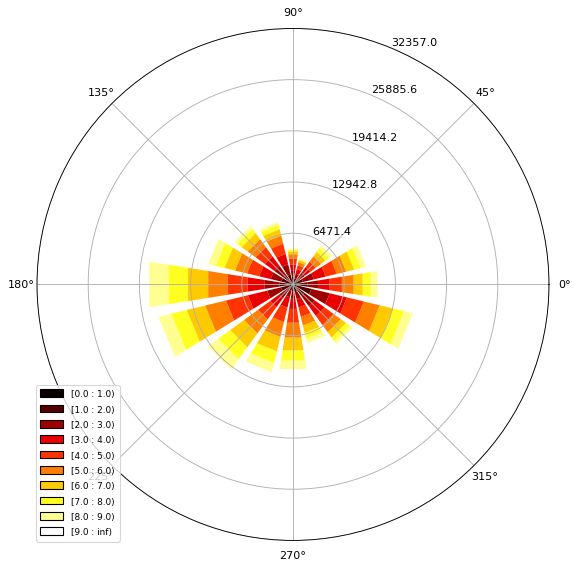
风玫瑰图(多种形式)
ax = WindroseAxes.from_ax()
ax.bar(df.direction.values, df.speed.values, bins=np.arange(0.01,10,1), cmap=cm.hot, lw=3)
ax.set_legend()复制
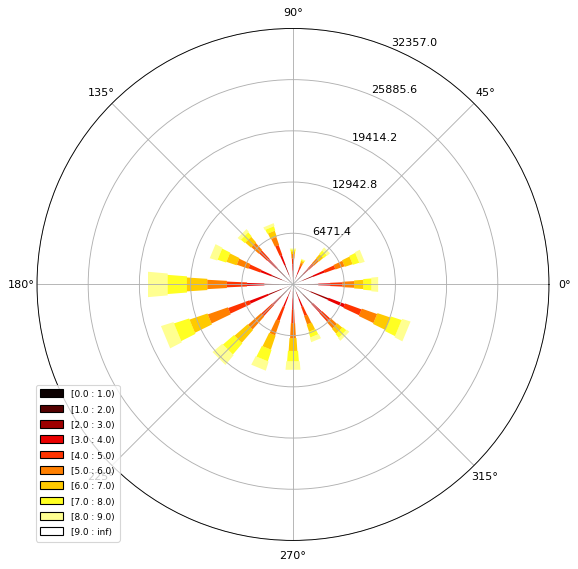
ax = WindroseAxes.from_ax()
ax.box(df.direction.values, df.speed.values, bins=np.arange(0.01,10,1), cmap=cm.hot, lw=3)
ax.set_legend()复制
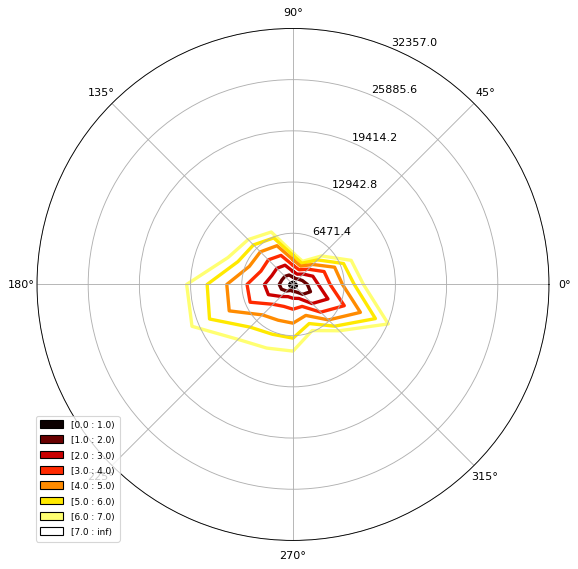
plot_windrose(df, kind='contour', bins=np.arange(0.01,8,1), cmap=cm.hot, lw=3)复制
绘制特定月份风玫瑰图
def plot_month(df, t_year_month, *args, **kwargs):
by = 'year_month'
df[by] = df.index.map(lambda dt: (dt.year, dt.month))
df_month = df[df[by] == t_year_month]
ax = plot_windrose(df_month, *args, **kwargs)
return ax
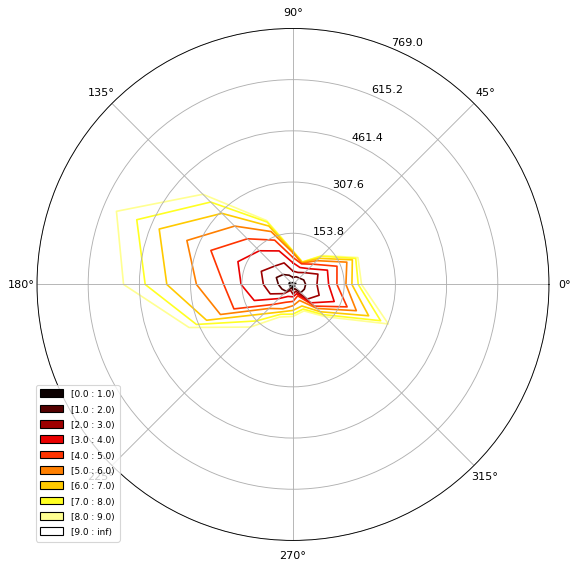
plot_month(df, (2014, 7), kind='contour', bins=np.arange(0, 10, 1), cmap=cm.hot)复制
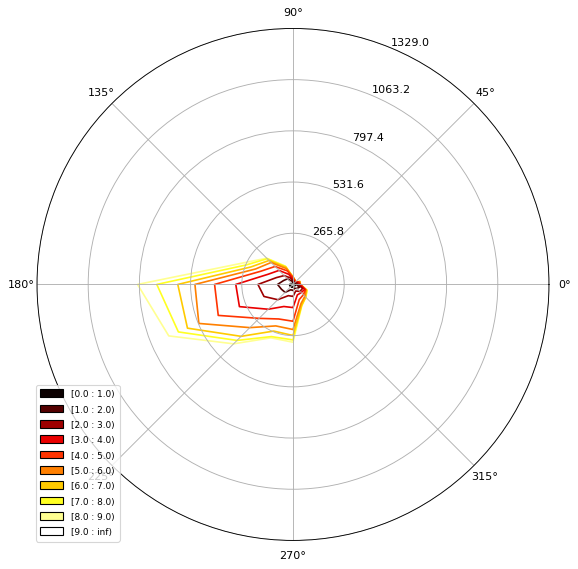
plot_month(df, (2014, 8), kind='contour', bins=np.arange(0, 10, 1), cmap=cm.hot)复制
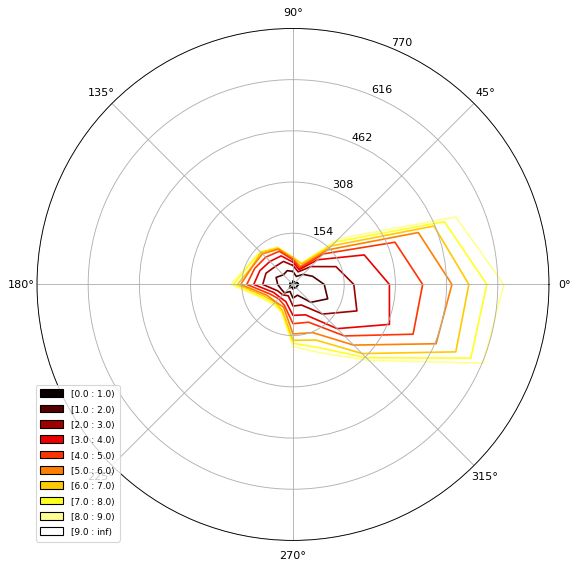
plot_month(df, (2014, 9), kind='contour', bins=np.arange(0, 10, 1), cmap=cm.hot)复制
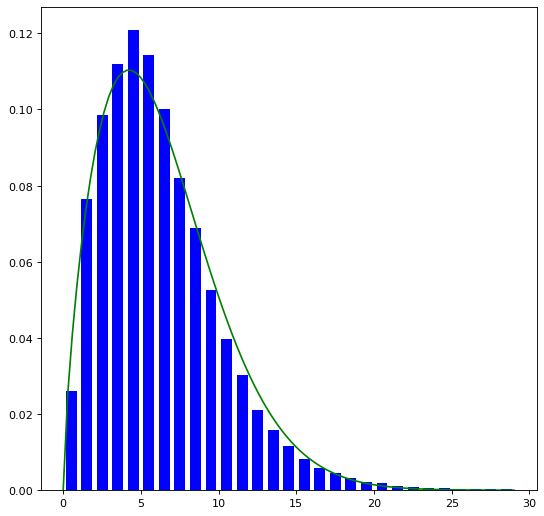
绘制风速频率直方图
bins = np.arange(0,30+1,1)
bins = bins[1:]
plot_windrose(df, kind='pdf', bins=np.arange(0.01,30,1),normed=True)复制
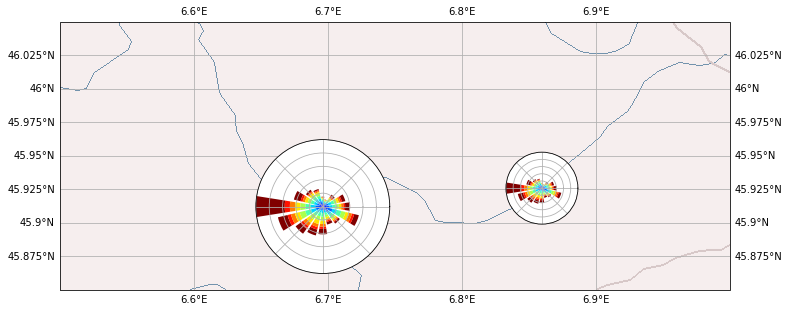
在地图上绘制风玫瑰图
proj = ccrs.PlateCarree()
fig = plt.figure(figsize=(12, 6))
minlon, maxlon, minlat, maxlat = (6.5, 7.0, 45.85, 46.05)
main_ax = fig.add_subplot(1, 1, 1, projection=proj)
main_ax.set_extent([minlon, maxlon, minlat, maxlat], crs=proj)
main_ax.gridlines(draw_labels=True)
main_ax.add_wms(wms='http://vmap0.tiles.osgeo.org/wms/vmap0',layers=['basic'])
cham_lon, cham_lat = (6.8599, 45.9259)
passy_lon, passy_lat = (6.7, 45.9159)
wrax_cham = inset_axes(main_ax,
width=1,
height=1,
loc='center',
bbox_to_anchor=(cham_lon, cham_lat),
bbox_transform=main_ax.transData,
axes_class=windrose.WindroseAxes,
)
height_deg = 0.1
wrax_passy = inset_axes(main_ax,
width="100%",
height="100%",
bbox_to_anchor=(passy_lon-height_deg/2, passy_lat-height_deg/2, height_deg, height_deg),
bbox_transform=main_ax.transData,
axes_class=windrose.WindroseAxes,
)
wrax_cham.bar(df.direction.values, df.speed.values,bins=np.arange(0.01,10,1), lw=3)
wrax_passy.bar(df.direction.values, df.speed.values,bins=np.arange(0.01,10,1), lw=3)
for ax in [wrax_cham, wrax_passy]:
ax.tick_params(labelleft=False, labelbottom=False)复制
数据与代码获取
在好奇心Log
公众号后台回复windrose
免费获取


数据下载 | CMIP6数据自动批量下载

python可视化 | 小波分析——海温数据的时频域分解

为了买房,我打开了ArcGIS

python可视化 | 单站空气质量日历图可视化
模式利器 | MEIC污染源清单向WRF-Chem模式网格插值分配工具——meic2wrf
数据处理·机器学习·可视化
行业资讯·学习资料


文章转载自气海无涯,如果涉嫌侵权,请发送邮件至:contact@modb.pro进行举报,并提供相关证据,一经查实,墨天轮将立刻删除相关内容。
评论
相关阅读
python排序sort()和sorted()区别
wzf0072
64次阅读
2025-04-09 19:57:46
AI与我共创WEB界面
布衣
56次阅读
2025-04-14 22:13:51
python中标识符的命名规则和命名规范
周同学带您玩AI
44次阅读
2025-04-21 10:34:44
解决pyqt5 textbrowser控件超链接锚点问题
zayki
37次阅读
2025-04-27 16:58:59
python 实现消费者优先级队列
天翼云开发者社区
28次阅读
2025-04-25 11:08:21
优雅遍历和删除特定开头的key
陌殇流苏
24次阅读
2025-04-25 12:17:03
《深入剖析Python的生成器表达式与列表推导式:探寻代码背后的哲学与艺术》
程序员阿伟
21次阅读
2025-04-27 16:22:14
python中的常见数据类型
周同学带您玩AI
14次阅读
2025-04-21 10:34:43
python自动更新dns A记录
godba
11次阅读
2025-04-23 11:19:04
Python运维神器:这些模块让你事半功倍
韩公子的Linux大集市
11次阅读
2025-04-09 11:13:18
