


通道由三条线构成 —— 上阻力线、下支撑线和中心线。
下面我们要来讲两种著名的通道技术 唐安奇和布林带,
唐安奇通道是后面学习海龟交易法则的基础 ,布林带通道想必大家也都听说过。
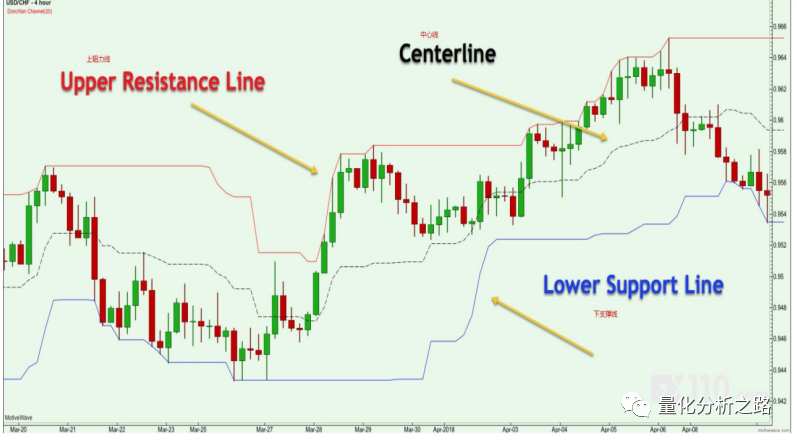
唐奇安通道指标计算:
唐奇安上阻力线 - 由过去N天的当日最高价的最大值形成。
唐奇安下支撑线 - 由过去N天的当日最低价的最小值形成。
中心线 =(上线 + 下线)/ 2
唐奇安通道常用作突破指标。它提供了两种主要类型的突破信号,一个是上阻力线或下支撑线,第二种突破信号是中心线交叉。
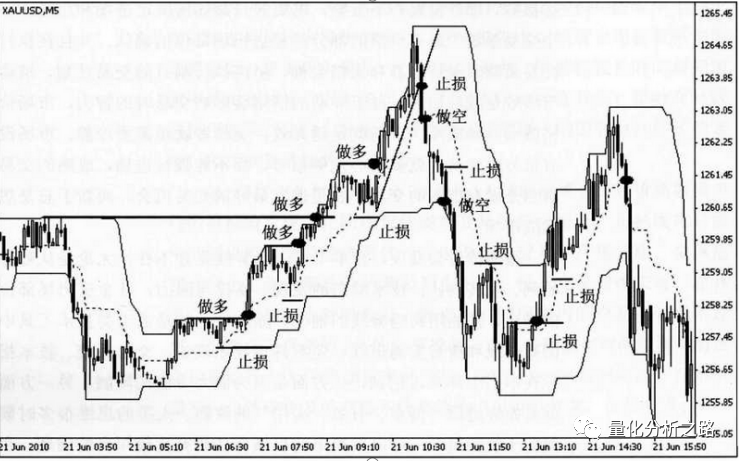
唐奇安通道指标支撑/阻力线突围信号
趋势交易者通常是沿着突破的方向进场,预计会有很强劲的趋势跟进,从而导致趋势价格的波动。使用唐奇安通道,当价格往上突破其上限时,做多;当价格往下突破其下限时,做空。

代码 即在股价突破通道上轨是做多 在股价跌破下轨时卖出
import numpy as npimport pandas as pdimport talibstart = '2015-01-01' # 回测起始时间end = '2016-06-01' # 回测结束时间universe = set_universe('ZZ500') # 证券池,支持股票、基金、期货、指数四种资产benchmark = 'ZZ500' # 策略参考标准freq = 'd' # 策略类型,'d'表示日间策略使用日线回测,'m'表示日内策略使用分钟线回测refresh_rate = 1 # 调仓频率,表示执行handle_data的时间间隔,若freq = 'd'时间间隔的单位为交易日,若freq = 'm'时间间隔为分钟# 配置账户信息,支持多资产多账户accounts = {'fantasy_account': AccountConfig(account_type='security', capital_base=10000000)}##周期N=15def initialize(context):passdef handle_data(context):timing(context)def timing_Basic_DC(context):account = context.get_account('fantasy_account')current_universe = context.get_universe( exclude_halt=True)security_position = account.get_positions()history = context.history(symbol=current_universe, time_range=N, attribute='closePrice',rtype='array')high_price = context.history(symbol=current_universe, time_range=N+1, attribute='highPrice',rtype='array')low_price = context.history(symbol=current_universe, time_range=N+1, attribute='lowPrice',rtype='array')cash = account.cashbuy_list = []for sec in current_universe:close = history[sec]['closePrice']up = high_price[sec]['highPrice']down = low_price[sec]['lowPrice']if close[-2] < up[:-2].max() and close[-1] > up[1:-1].max() and sec not in security_position:buy_list.append(sec)if close[-2] > up[:-2].min() and close[-1] < up[1:-1].min() and sec in security_position:account.order_pct_to(sec,0)cash += security_position[sec].amount * context.current_price(sec)d = min(len(buy_list),int(cash)//20000)for sec in buy_list[:d]:account.order(sec,20000/context.current_price(sec))
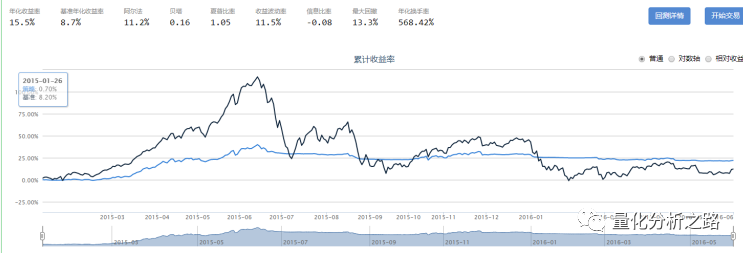
回测结果
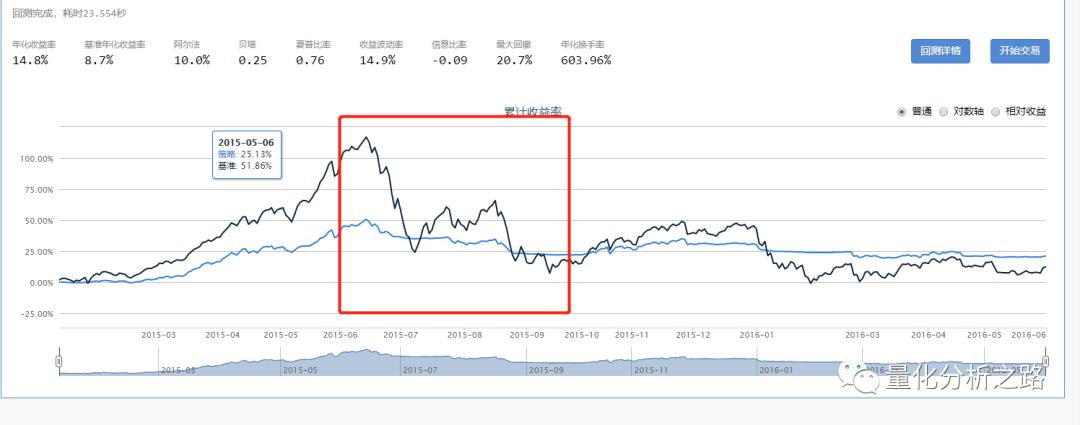
结果 跑赢大盘 并且在股灾的时候回撤小于大盘 还可以
二 :布林带通道
(1)中轨线=N日的移动平均线;
(2)上轨线=中轨线+两倍的标准差;
(3)下轨线=中轨线-两倍的标准差;

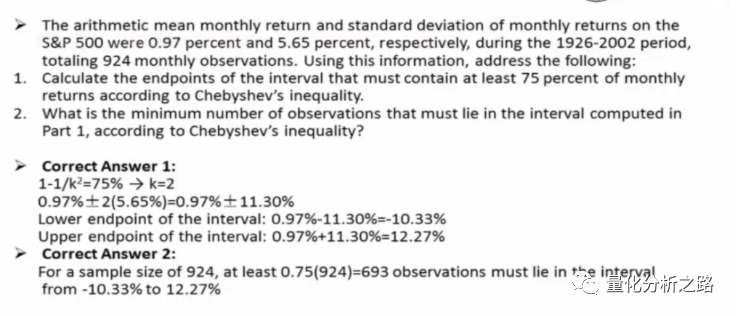
他是根据数学原理切比雪夫不等式算出的 。即股价在平均价的正负标准差之间的概率为1-1/k*k 如果股价超过该范围 则视为小概率事件。
我做了两个回测 一是
股价突破通道上轨做多 在股价跌破下轨时卖出
二是
股价突破通道上轨卖出 在股价跌破下轨时买入
import numpy as npimport pandas as pdimport talibstart = '2015-01-01' # 回测起始时间end = '2016-06-01' # 回测结束时间universe = set_universe('ZZ500') # 证券池,支持股票、基金、期货、指数四种资产benchmark = 'ZZ500' # 策略参考标准freq = 'd' # 策略类型,'d'表示日间策略使用日线回测,'m'表示日内策略使用分钟线回测refresh_rate = 1 # 调仓频率,表示执行handle_data的时间间隔,若freq = 'd'时间间隔的单位为交易日,若freq = 'm'时间间隔为分钟# 配置账户信息,支持多资产多账户accounts = {'fantasy_account': AccountConfig(account_type='security', capital_base=10000000)}##买入卖出阈值N=20k=1.96def initialize(context):passdef handle_data(context):timing(context)def timing_Basic_BULL(context):account = context.get_account('fantasy_account')current_universe = context.get_universe( exclude_halt=True)# log.info(current_universe)security_position = account.get_positions()history = context.history(symbol=current_universe, time_range=N+1, attribute='closePrice',rtype='array')cash = account.cashbuy_list = []for sec in current_universe:close = history[sec]['closePrice']up,mid,down = talib.BBANDS(close,timeperiod=N, nbdevup=k, nbdevdn=k )if close[-2] > down[-2] and close[-1] < down[-1] and sec not in security_position:buy_list.append(sec)if close[-2] < up[-2] and close[-1] > up[-1] and sec in security_position:account.order_pct_to(sec,0)cash += security_position[sec].amount * context.current_price(sec)d = min(len(buy_list),int(cash)//20000)for sec in buy_list[:d]:account.order(sec,20000/context.current_price(sec))def timing(context):return timing_Basic_BULL(context)复制
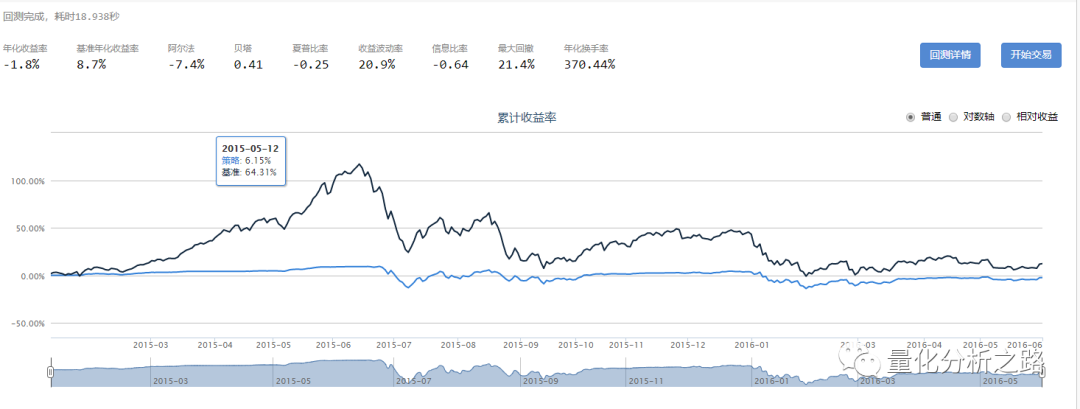
图一时 突破上轨做多 跌破下轨卖出
图二是 突破上轨卖出 跌破下轨买入
用的都是日线级别的K线回测 第二种方法回测结果很一般
文章转载自量化分析之路,如果涉嫌侵权,请发送邮件至:contact@modb.pro进行举报,并提供相关证据,一经查实,墨天轮将立刻删除相关内容。
评论
相关阅读
2025年4月中国数据库流行度排行榜:OB高分复登顶,崖山稳驭撼十强
墨天轮编辑部
2272次阅读
2025-04-09 15:33:27
数据库国产化替代深化:DBA的机遇与挑战
代晓磊
1046次阅读
2025-04-27 16:53:22
2025年3月国产数据库大事记
墨天轮编辑部
959次阅读
2025-04-03 15:21:16
2025年3月国产数据库中标情况一览:TDSQL大单622万、GaussDB大单581万……
通讯员
657次阅读
2025-04-10 15:35:48
数据库,没有关税却有壁垒
多明戈教你玩狼人杀
526次阅读
2025-04-11 09:38:42
国产数据库需要扩大场景覆盖面才能在竞争中更有优势
白鳝的洞穴
508次阅读
2025-04-14 09:40:20
最近我为什么不写评论国产数据库的文章了
白鳝的洞穴
466次阅读
2025-04-07 09:44:54
【活动】分享你的压箱底干货文档,三篇解锁进阶奖励!
墨天轮编辑部
419次阅读
2025-04-17 17:02:24
2025年4月国产数据库中标情况一览:4个千万元级项目,GaussDB与OceanBase大放异彩!
通讯员
398次阅读
2025-04-30 15:24:06
天津市政府数据库框采结果公布,7家数据库产品入选!
通讯员
396次阅读
2025-04-10 12:32:35
