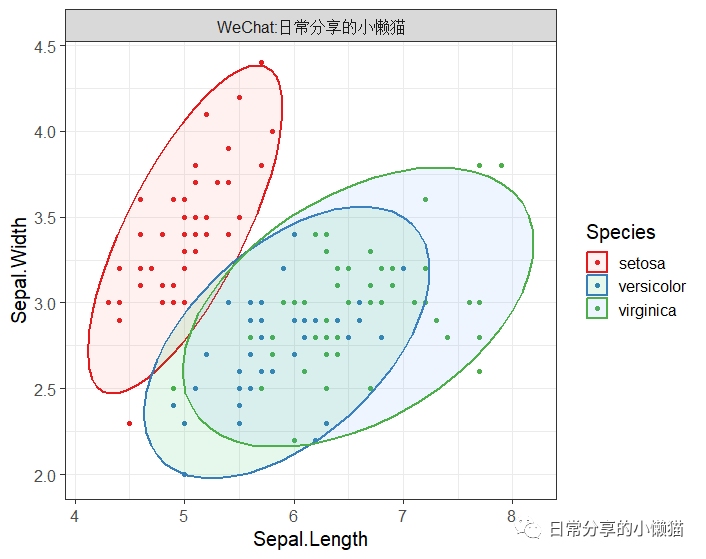
本期主要介绍在使用ggplot2绘制散点图时,如何为散点图添加椭圆形状,如下图所示。更多内容可关注微信公众号日常分享的小懒猫
。
1、数据准备
install.packages("ggplot2")
library(ggplot2)
head(iris)
# Sepal.Length Sepal.Width Petal.Length Petal.Width Species
#1 5.1 3.5 1.4 0.2 setosa
#2 4.9 3.0 1.4 0.2 setosa
#3 4.7 3.2 1.3 0.2 setosa
#4 4.6 3.1 1.5 0.2 setosa
#5 5.0 3.6 1.4 0.2 setosa
#6 5.4 3.9 1.7 0.4 setosa复制
2、图形绘制
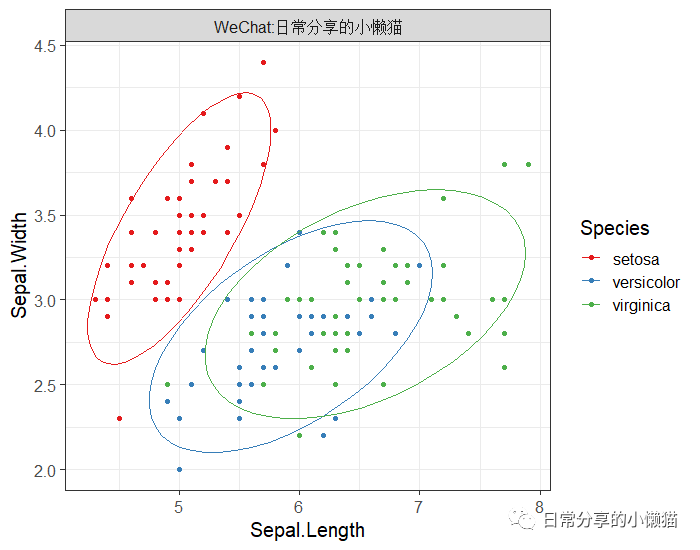
主要使用stat_ellipse() 函数。
2.1 基础图形
ggplot(iris, aes(Sepal.Length, Sepal.Width, color = Species)) +
geom_point() +
stat_ellipse() +
theme_bw(base_size = 15) +
scale_color_brewer(palette = "Set1")复制
2.2 参数调整
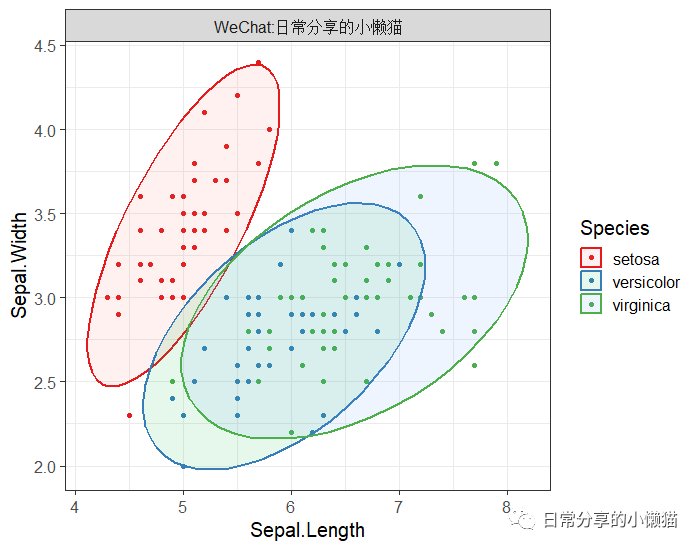
type
表示数据分布类型,默认为t分布,type = "t"
,geom
为几何对象,linetype
与linewidth
分别表示线的类型与厚度,alpha
表示颜色深浅。
ggplot(iris, aes(Sepal.Length, Sepal.Width, color = Species, fill = Species)) +
geom_point() +
stat_ellipse(type = "norm", linetype = 1, linewidth = 1, geom = "polygon", alpha = 0.1) +
theme_bw(base_size = 15) +
scale_color_brewer(palette = "Set1")复制
2.3 修改形状
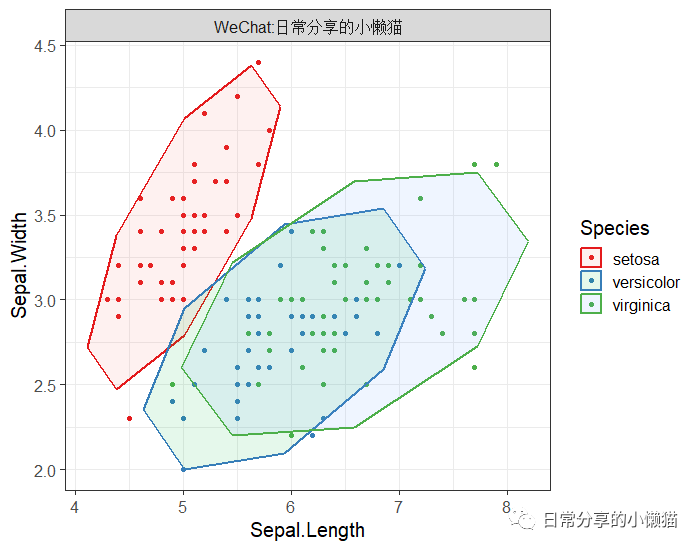
segments
表示绘制椭圆时使用的线段数,为8则表示八边形。
ggplot(iris, aes(Sepal.Length, Sepal.Width, color = Species)) +
geom_point() +
stat_ellipse(aes(fill = Species), segments = 8, geom = "polygon", alpha = 0.1, type = "norm", linetype = 1, linewidth = 1) +
theme_bw(base_size = 15) +
scale_color_brewer(palette = "Set1")复制
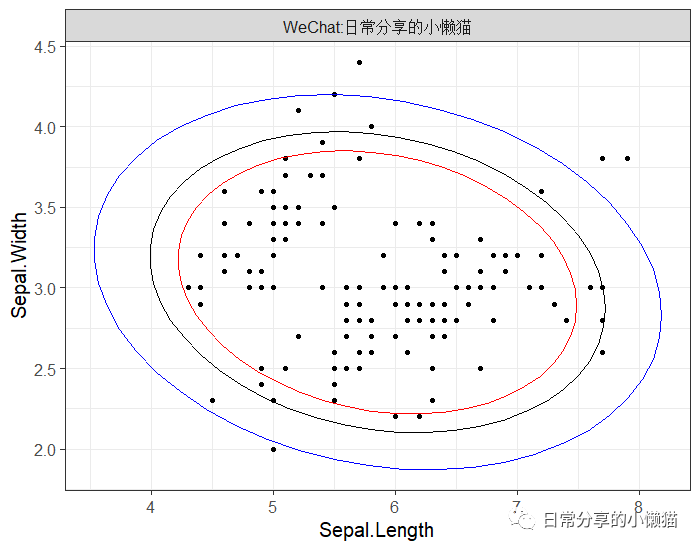
2.4 区间设置
level
表示包含多少数据,默认设置为level = 0.95
,包含95%的数据。
ggplot(iris, aes(Sepal.Length, Sepal.Width)) +
geom_point() +
stat_ellipse(level = 0.9, color = "red") +
stat_ellipse(level = 0.95, color = "black") + # default
stat_ellipse(level = 0.99, color = "blue") +
theme_bw(base_size = 15)复制
附录:stat_ellipse()参数
stat_ellipse(
mapping = NULL,
data = NULL,
geom = "path",
position = "identity",
...,
type = "t",
level = 0.95,
segments = 51,
na.rm = FALSE,
show.legend = NA,
inherit.aes = TRUE
)复制
3、其他
更多内容可关注微信公众号【日常分享的小懒猫】。
如有帮助请多多点赞哦!
文章转载自日常分享的小懒猫,如果涉嫌侵权,请发送邮件至:contact@modb.pro进行举报,并提供相关证据,一经查实,墨天轮将立刻删除相关内容。


