


本文主要介绍在R语言中如何利用for循环进行ggplot2的批量绘图。如下图所示: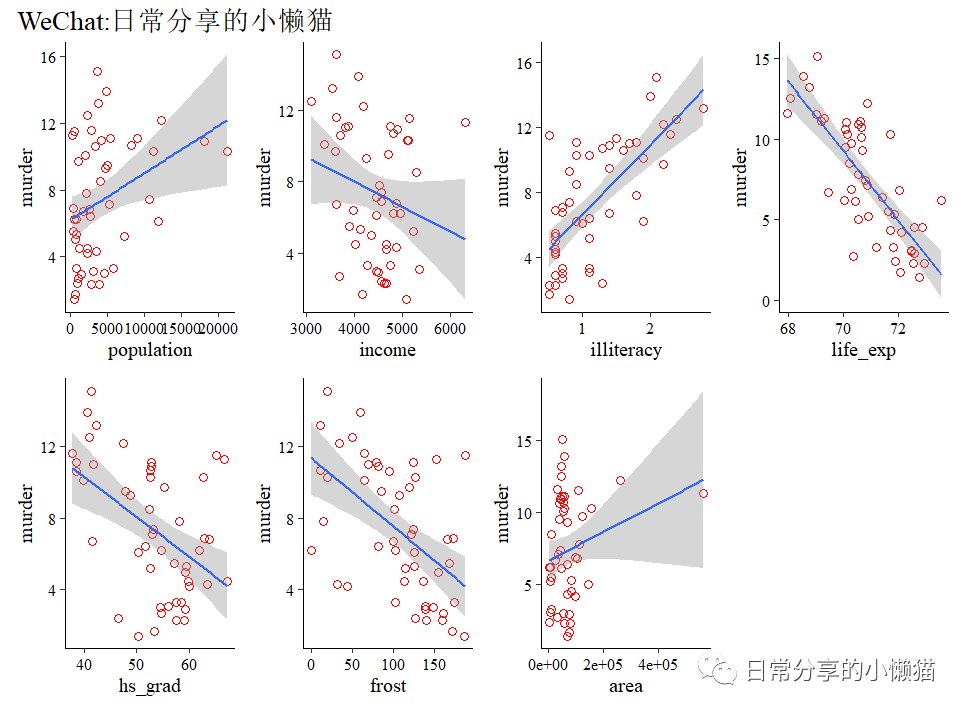
1、数据准备
library(dplyr)
library(ggplot2)
library(patchwork)
# Souce:WeChat:日常分享的小懒猫
> states <- state.x77 %>% as.data.frame() %>% janitor::clean_names()
> head(states)
# population income illiteracy life_exp murder hs_grad frost area
# Alabama 3615 3624 2.1 69.05 15.1 41.3 20 50708
# Alaska 365 6315 1.5 69.31 11.3 66.7 152 566432
# Arizona 2212 4530 1.8 70.55 7.8 58.1 15 113417
# Arkansas 2110 3378 1.9 70.66 10.1 39.9 65 51945
# California 21198 5114 1.1 71.71 10.3 62.6 20 156361
# Colorado 2541 4884 0.7 72.06 6.8 63.9 166 103766
> str(states)
# 'data.frame': 50 obs. of 8 variables:
# $ population: num 3615 365 2212 2110 21198 ...
# $ income : num 3624 6315 4530 3378 5114 ...
# $ illiteracy: num 2.1 1.5 1.8 1.9 1.1 0.7 1.1 0.9 1.3 2 ...
# $ life_exp : num 69 69.3 70.5 70.7 71.7 ...
# $ murder : num 15.1 11.3 7.8 10.1 10.3 6.8 3.1 6.2 10.7 13.9 ...
# $ hs_grad : num 41.3 66.7 58.1 39.9 62.6 63.9 56 54.6 52.6 40.6 ...
# $ frost : num 20 152 15 65 20 166 139 103 11 60 ...
# $ area : num 50708 566432 113417 51945 156361 ...复制
2、图形绘制
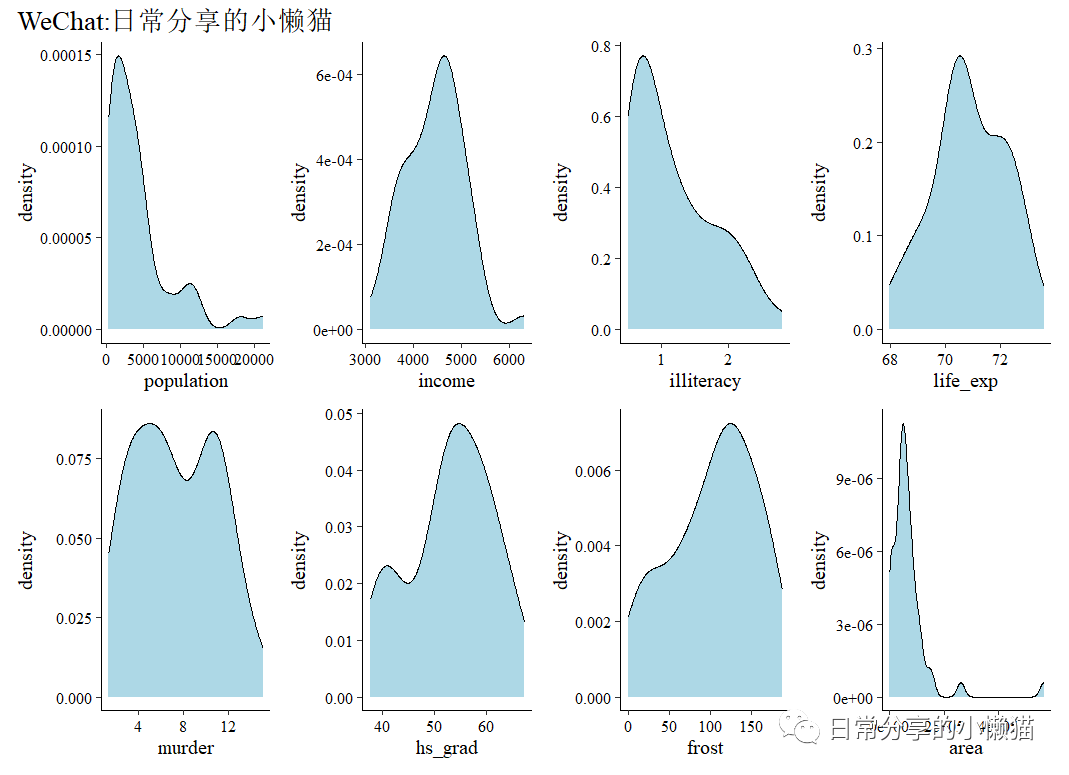
2.1 绘制密度图
以绘制8个变量的密度图分布为例。
> x_variable <- names(states)
> x_variable
# [1] "population" "income" "illiteracy" "life_exp" "murder" "hs_grad" "frost" "area"
plot_list <- list()
# Souce:WeChat:日常分享的小懒猫
for( i in x_variable){
plot_list[[i]] <- ggplot(states, aes_string(x = i)) +
geom_density(fill = "lightblue") +
theme_classic(base_size = 15) +
theme(axis.text = element_text(colour = "black"))
}
wrap_plots(plot_list, ncol = 4)复制
2.2 绘制散点图
以murder为y轴变量,其余变量为x变量,绘制散点图并添加拟合曲线。
x_variable <- names(states %>% select(-murder))
x_variable
# [1] "population" "income" "illiteracy" "life_exp" "hs_grad" "frost" "area"
plot_list <- list()
# Souce:WeChat:日常分享的小懒猫
for( i in x_variable){
plot_list[[i]] <- ggplot(states, aes_string(y = "murder", x = i)) +
geom_point(size = 3, shape = 21, color = "red") +
geom_smooth(method = "lm") +
theme_classic(base_size = 15) +
theme(axis.text = element_text(colour = "black"))
}
wrap_plots(plot_list, ncol = 4)复制
3、tips
在使用for循环进行ggplot2批量绘图时,需要用到的美学映射函数为aes_string() ,而非aes() 。二者的区别主要在于,aes_string() 函数引用变量时需要加引号,而aes() 函数引用变量时无须加入引号。此外,在拼图的过程中,可使用patchwork包中的wrap_plots() 函数。
4、其他
更多内容可关注微信公众号【日常分享的小懒猫】。
如有帮助请多多点赞哦!
文章转载自日常分享的小懒猫,如果涉嫌侵权,请发送邮件至:contact@modb.pro进行举报,并提供相关证据,一经查实,墨天轮将立刻删除相关内容。
