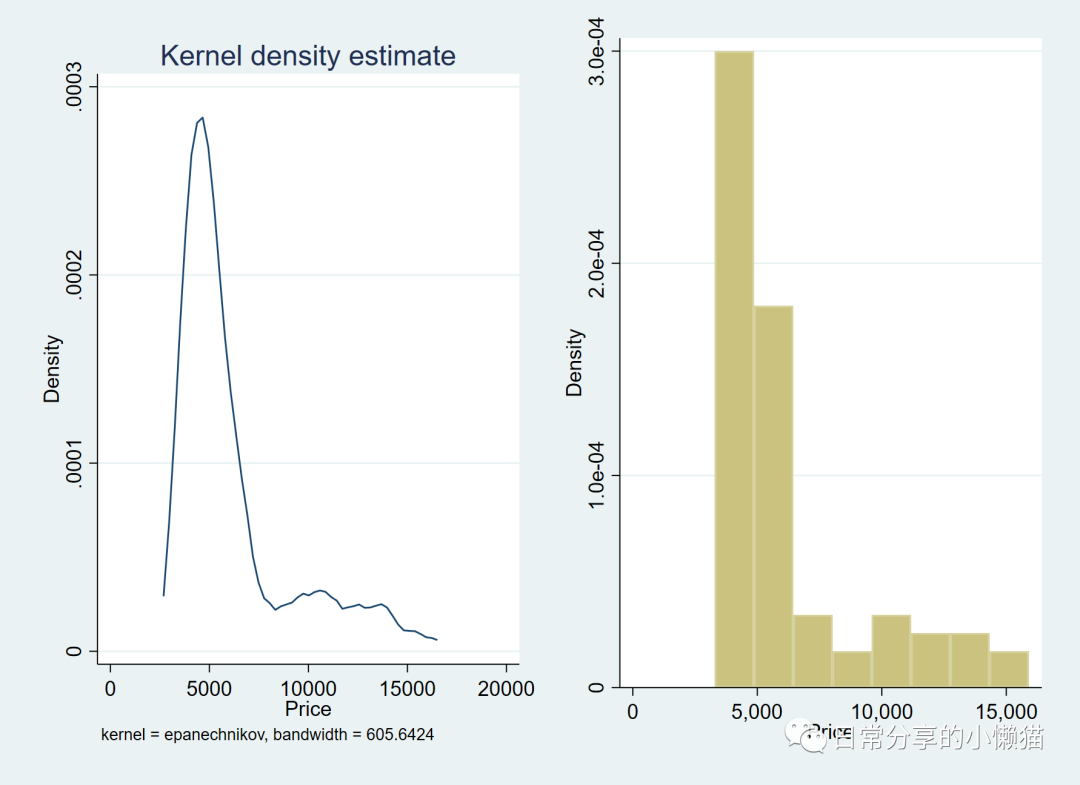
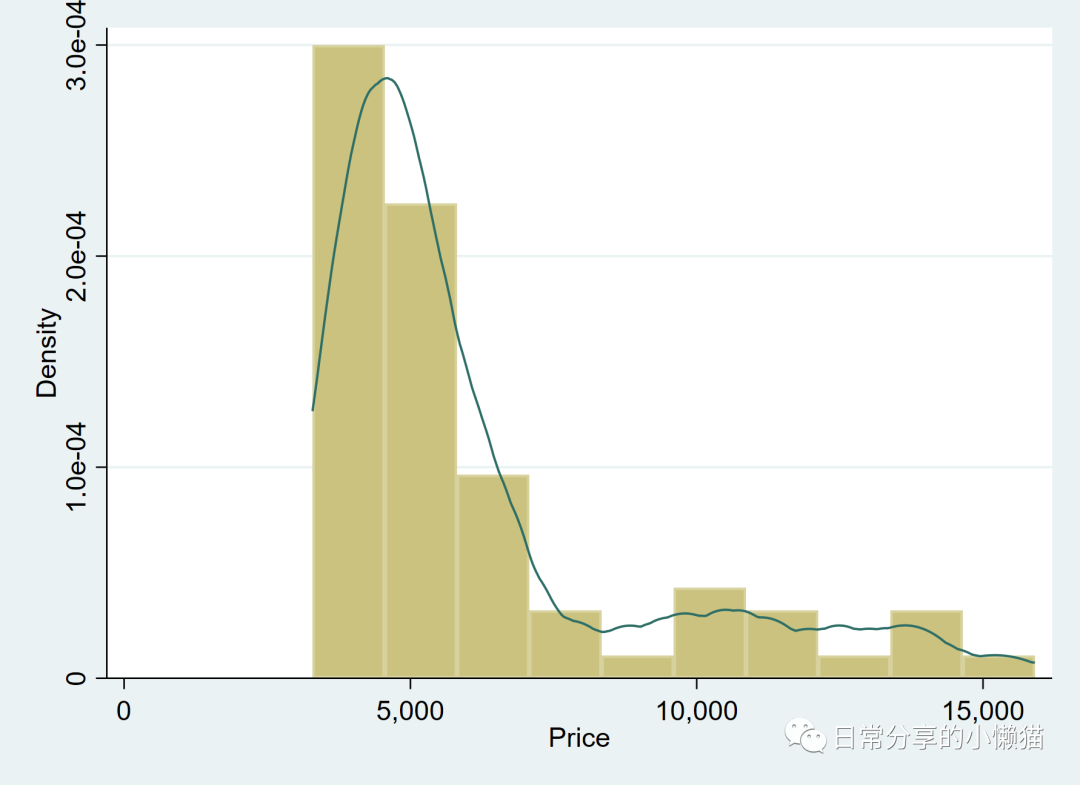
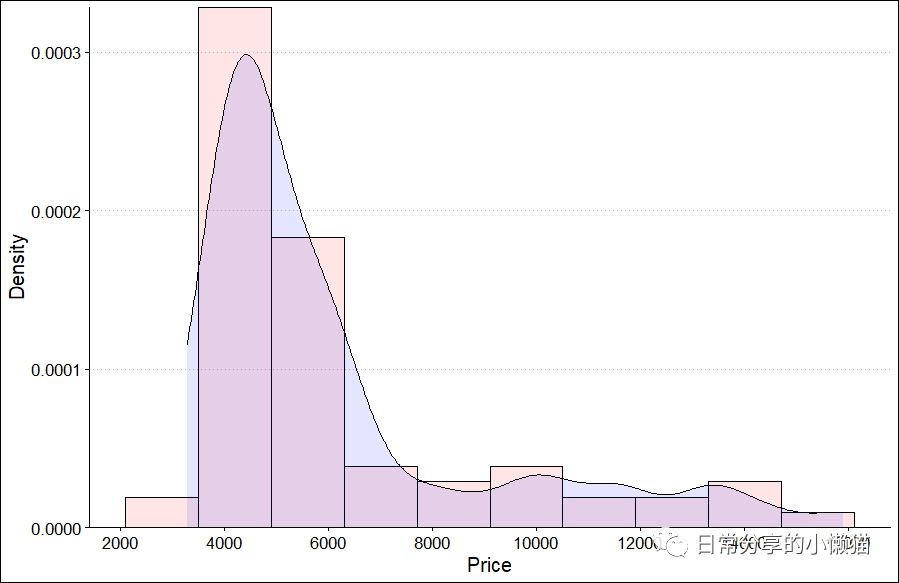
本文主要展示如何绘制带有密度图的直方图。以stata自带的auto数据集为例,分别使用Stata、R语言与Python绘制该数据集中的price变量的直方图与密度图。
1、Stata
clear
sysuse auto
kdensity price
graph save plot1.gph, replace
histogram price
graph save plot2.gph, replace
graph combine plot1.gph plot2.gph复制
2种方法进行图形叠加
histogram price,bin(10) kdensity //方法1
histogram price,bin(10) addplot(kdensity price) //方法2复制
2、R语言
数据可从stata软件中直接导出,或在后台回复【20220911】获取。
#加载package
library(ggplot2)
library(haven)
library(ggthemes)
auto <- haven::read_dta("auto.dta") #read data
#绘图
ggplot(auto, aes(price)) +
geom_histogram(aes(y = ..density..), bins = 10, color = "black", fill = "white") +
geom_density(fill = "blue", alpha = 0.2) +
scale_y_continuous(expand = c(0,0), labels = ~format(.x, scientific = FALSE)) +
scale_x_continuous(breaks = seq(2000, 18000, 2000)) +
theme_clean() +
labs(x = "Price", y = "Density") +
theme(axis.text = element_text(size = 13),
axis.title = element_text(size = 15))复制
使用theme_stata() 主题,绘制stata风格。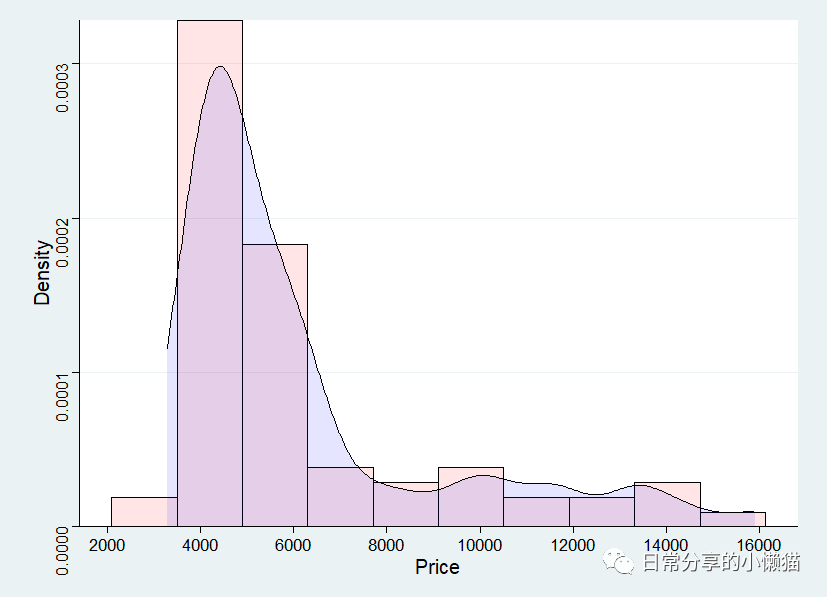
3、Python
将数据放置在jupyter启动的目录下。
#加载相关库
import pandas as pd
import seaborn as sns
import matplotlib.pyplot as plt
import warnings
warnings.filterwarnings("ignore")
auto = pd.io.stata.read_stata("auto.dta") #read data
auto.head()复制
方法1
#绘图
sns.set_theme(style="ticks", font = "Times New Roman", font_scale=1.2)
#sns.set_theme()
plt.figure(figsize=(10,5))
sns.distplot(auto["price"], kde = True, rug = False, bins = 10, hist = True, vertical = False ,
hist_kws = {"color":"r"}, kde_kws = {'linestyle':'--',"shade":True, "color":"blue", "alpha":0.1});
plt.savefig("密度图与直方图.pdf")复制
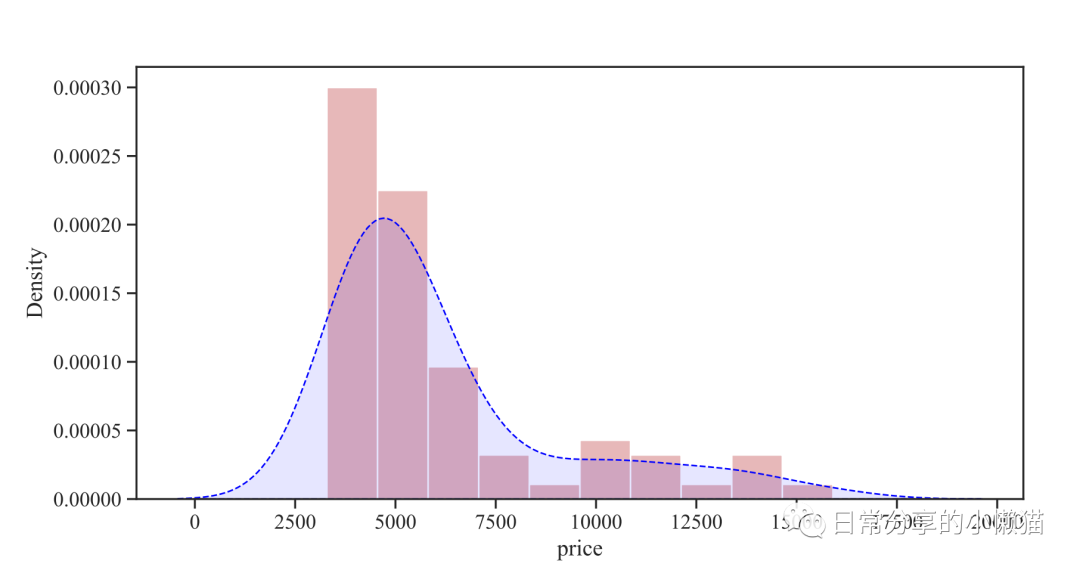
方法2
plt.figure(figsize=(10,5))
sns.histplot(data=auto, x="price", kde=True,alpha = 0.3, stat="density");
plt.savefig("密度图与直方图2.pdf")复制
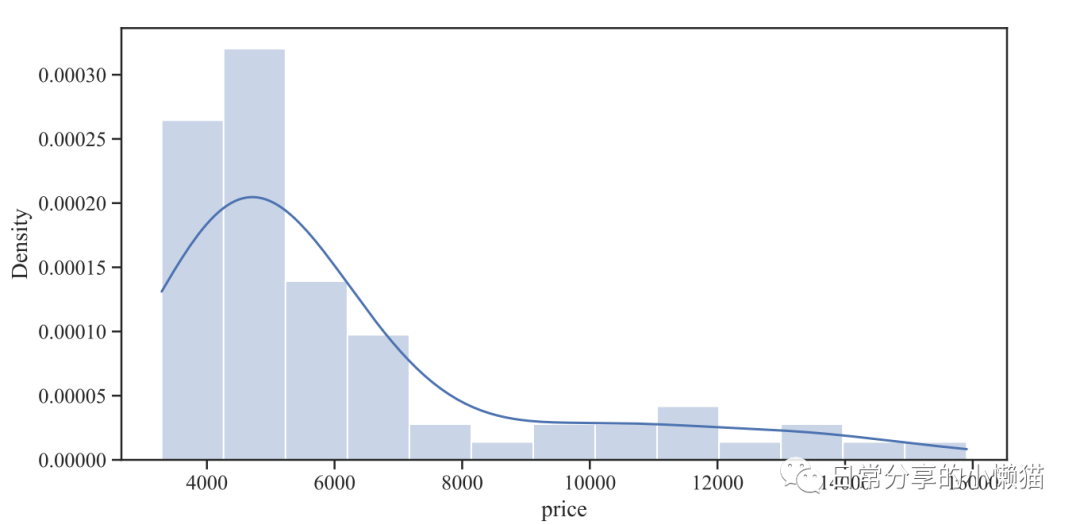
4、其他
其他绘图方法可进一步阅读公众号其他文章。
如有帮助请多多点赞哦!
文章转载自日常分享的小懒猫,如果涉嫌侵权,请发送邮件至:contact@modb.pro进行举报,并提供相关证据,一经查实,墨天轮将立刻删除相关内容。
评论
相关阅读
MySQL8.0直方图功能简介
Rock Yan
269次阅读
2025-03-21 15:30:53
[MYSQL] 服务器出现大量的TIME_WAIT, 每天凌晨就清零了
大大刺猬
150次阅读
2025-04-01 16:20:44
mysql提升10倍count(*)的神器
大大刺猬
128次阅读
2025-03-21 16:54:21
演讲实录|分布式 Python 计算服务 MaxFrame 介绍及场景应用方案
阿里云大数据AI技术
125次阅读
2025-03-17 13:27:37
官宣,Milvus SDK v2发布!原生异步接口、支持MCP、性能提升
ZILLIZ
97次阅读
2025-04-02 09:34:13
[MYSQL] query_id和STATEMENT_ID在不同OS上的关系
大大刺猬
71次阅读
2025-03-26 19:08:13
DataWorks :Data+AI 一体化开发实战图谱
阿里云大数据AI技术
48次阅读
2025-03-19 11:00:55
国密算法介绍
漫步者
46次阅读
2025-03-21 09:20:39
如何使用 RisingWave 和 PuppyGraph 构建高性能实时图分析框架
RisingWave中文开源社区
39次阅读
2025-03-18 10:49:54
WingPro for Mac 强大的Python开发工具 v10.0.9注册激活版
一梦江湖远
34次阅读
2025-03-29 10:33:27


